Milky Way from Taurus to Perseus
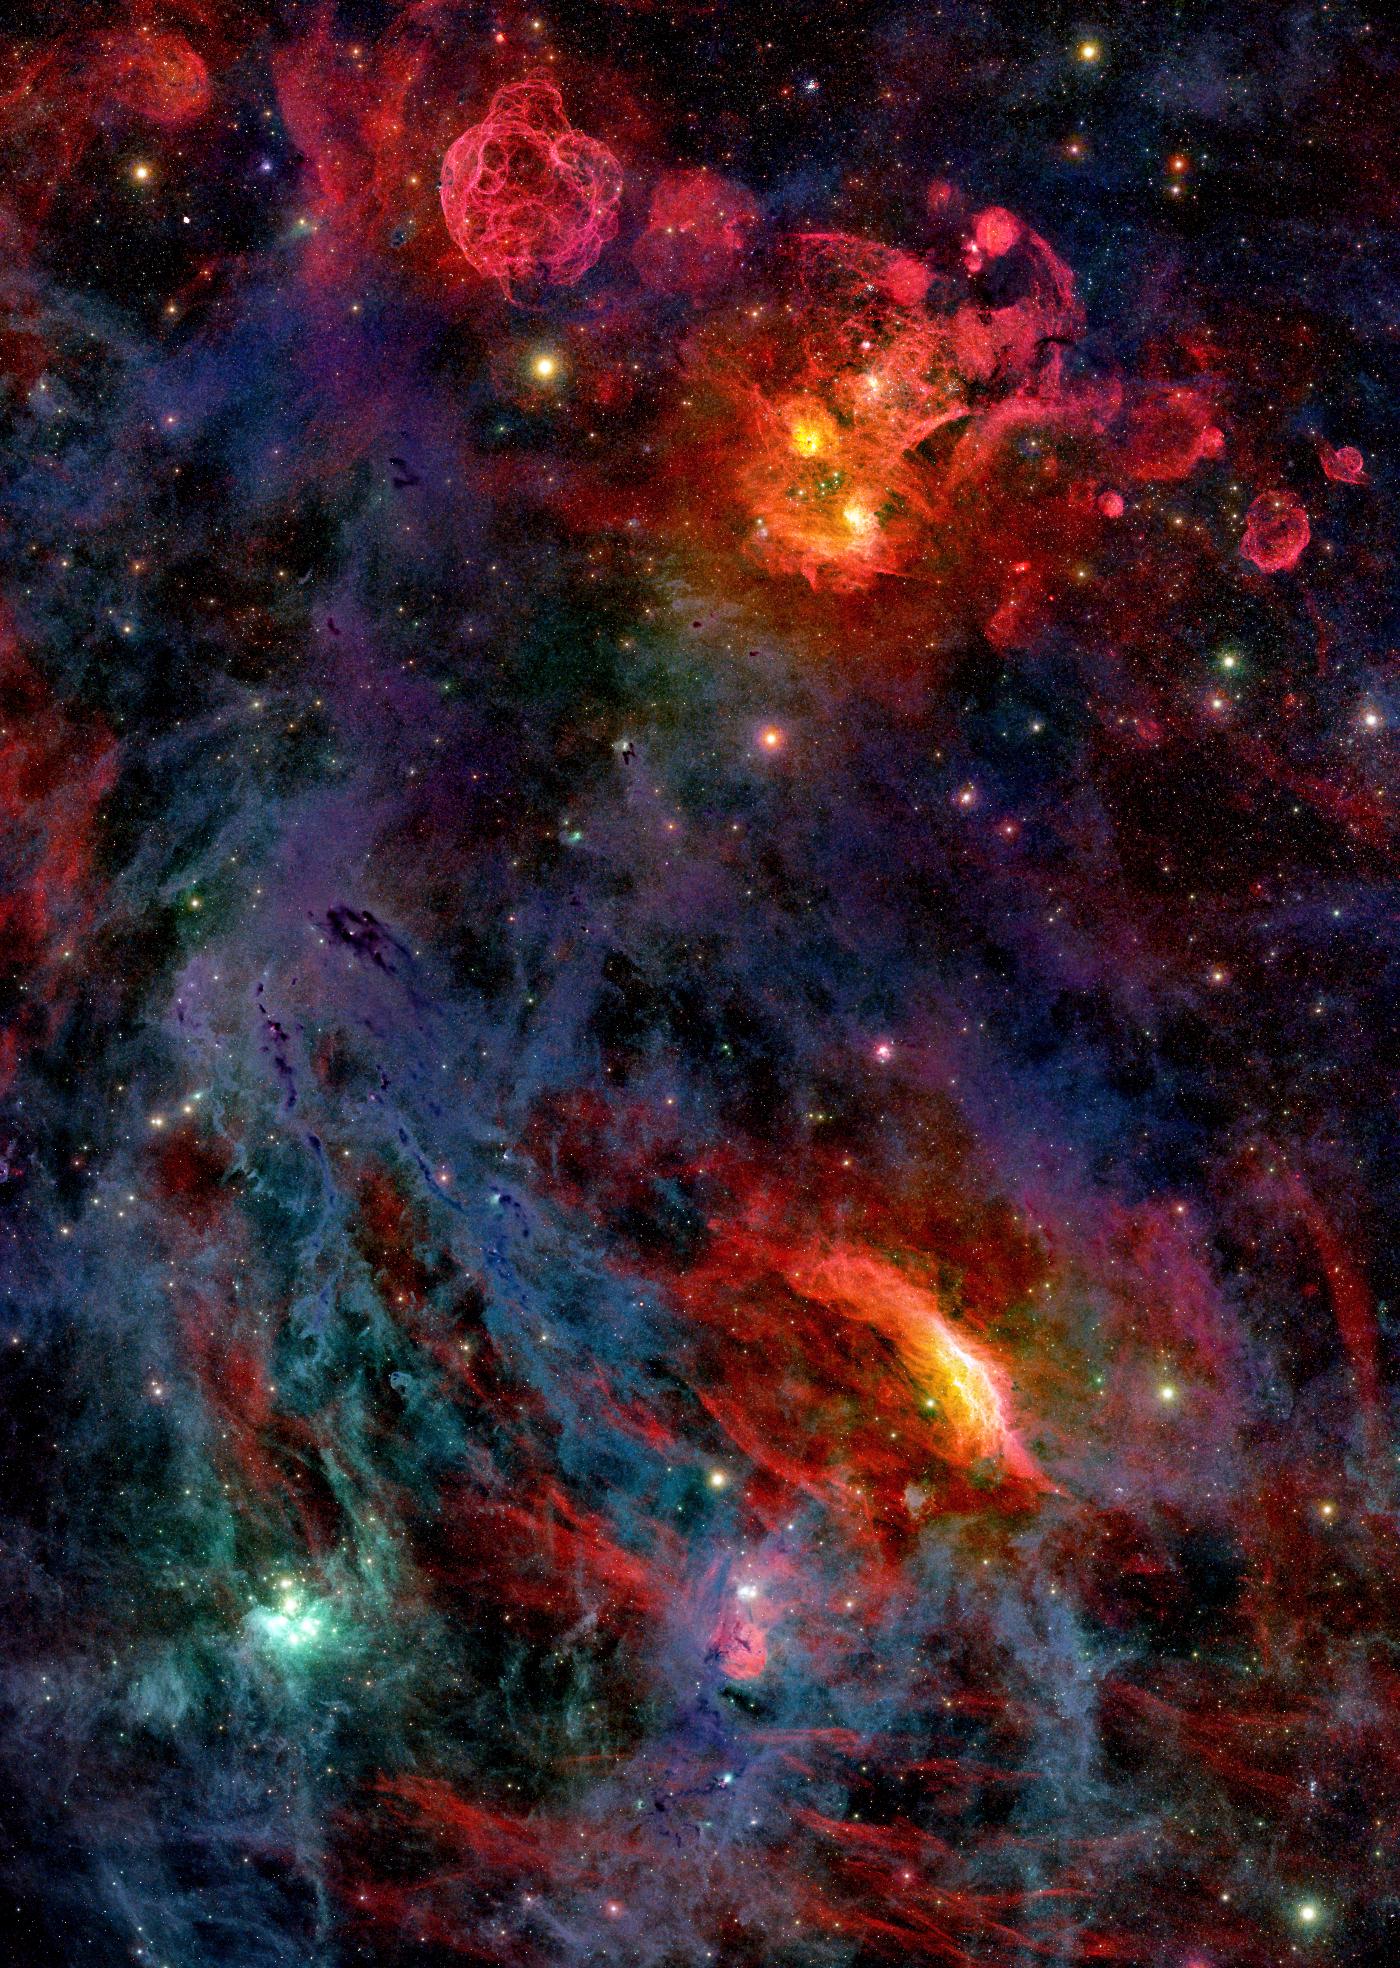
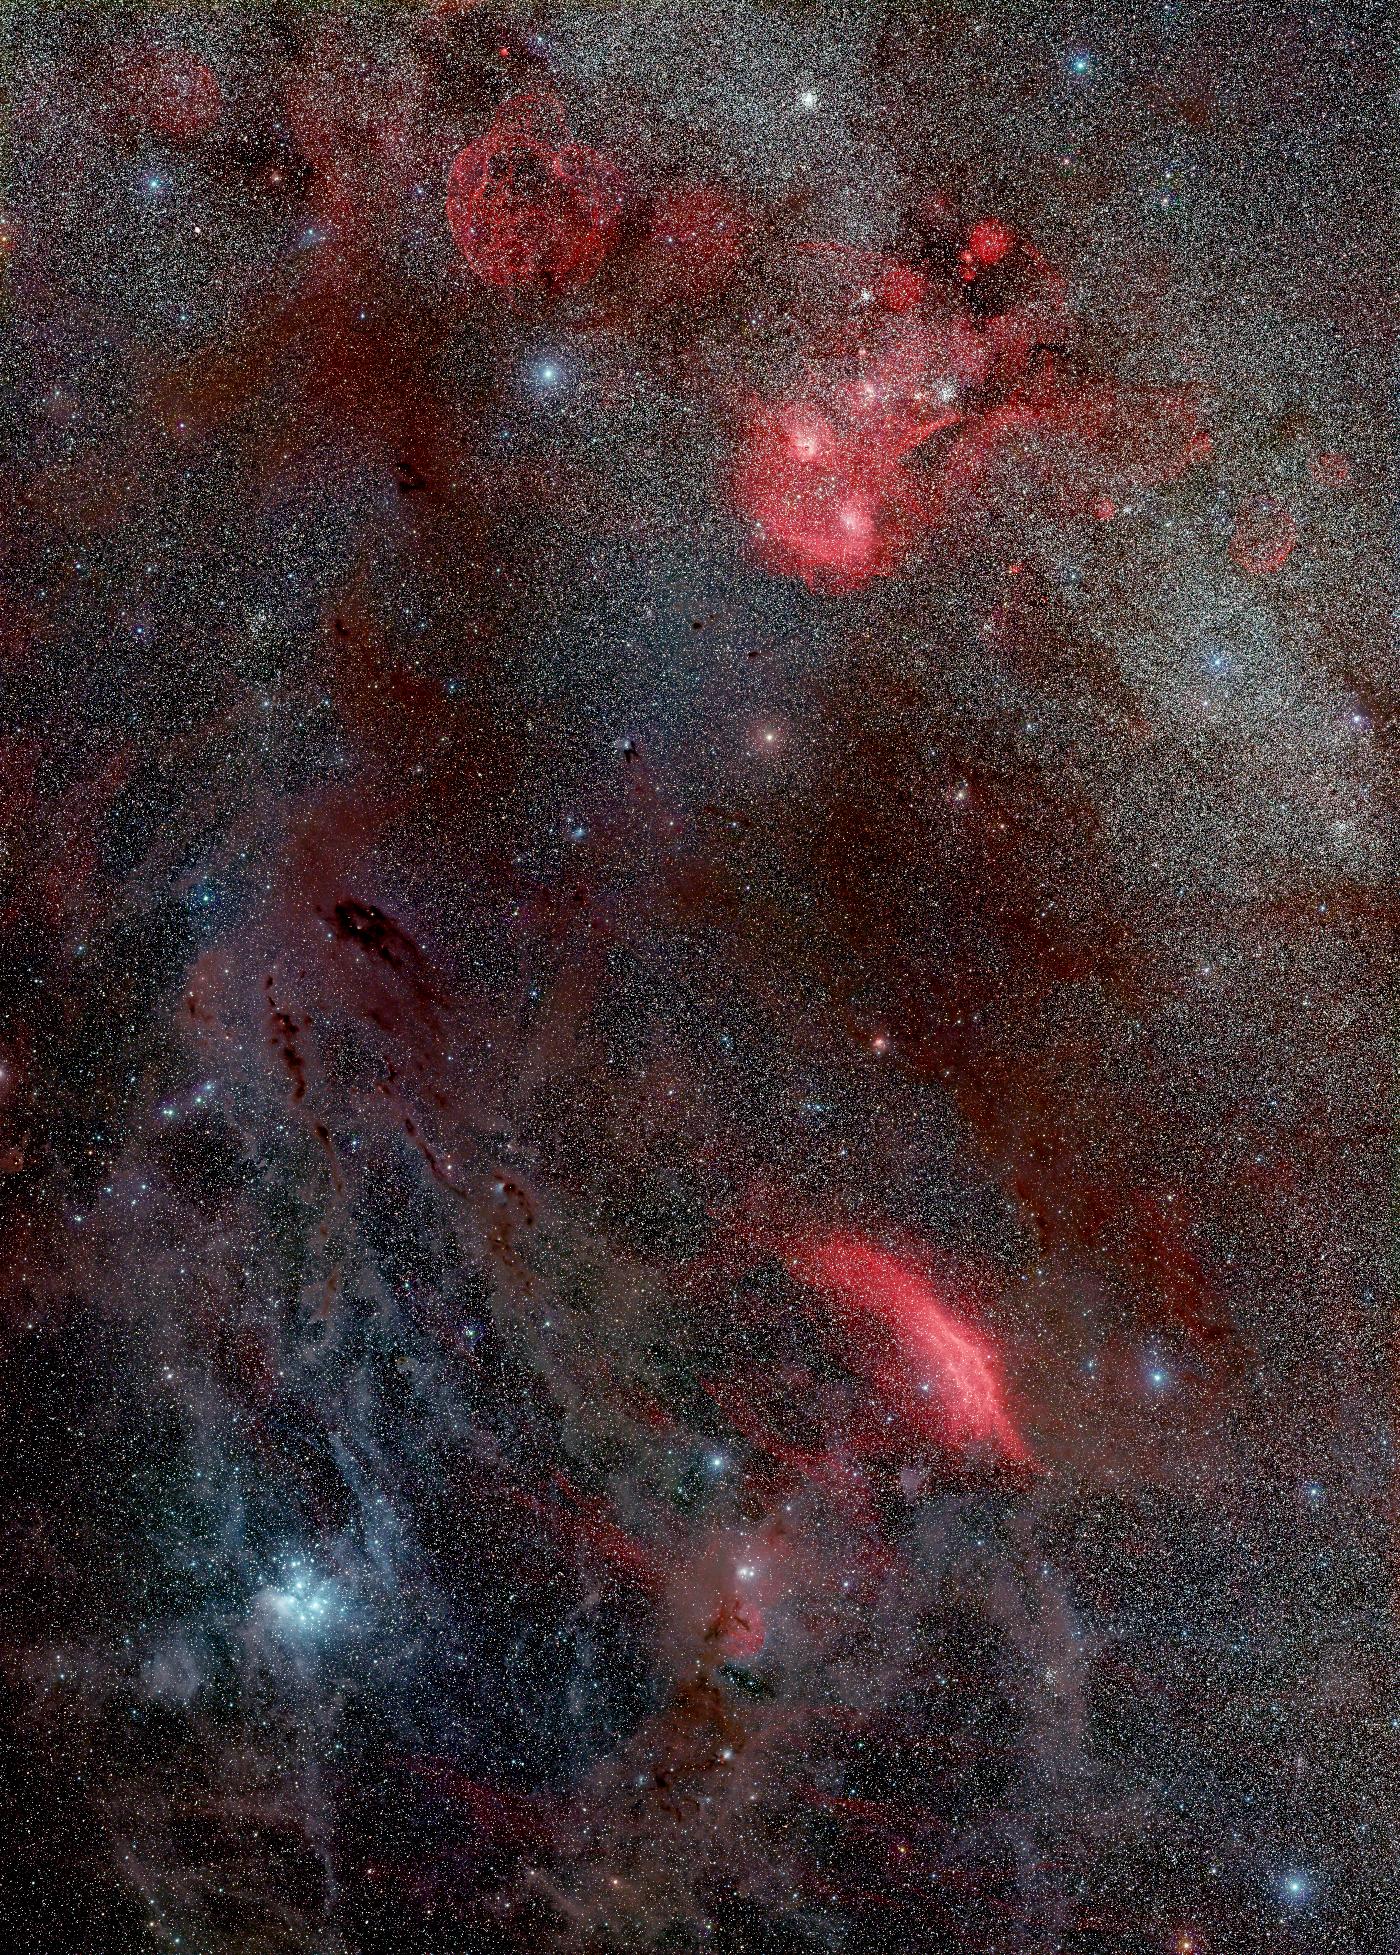
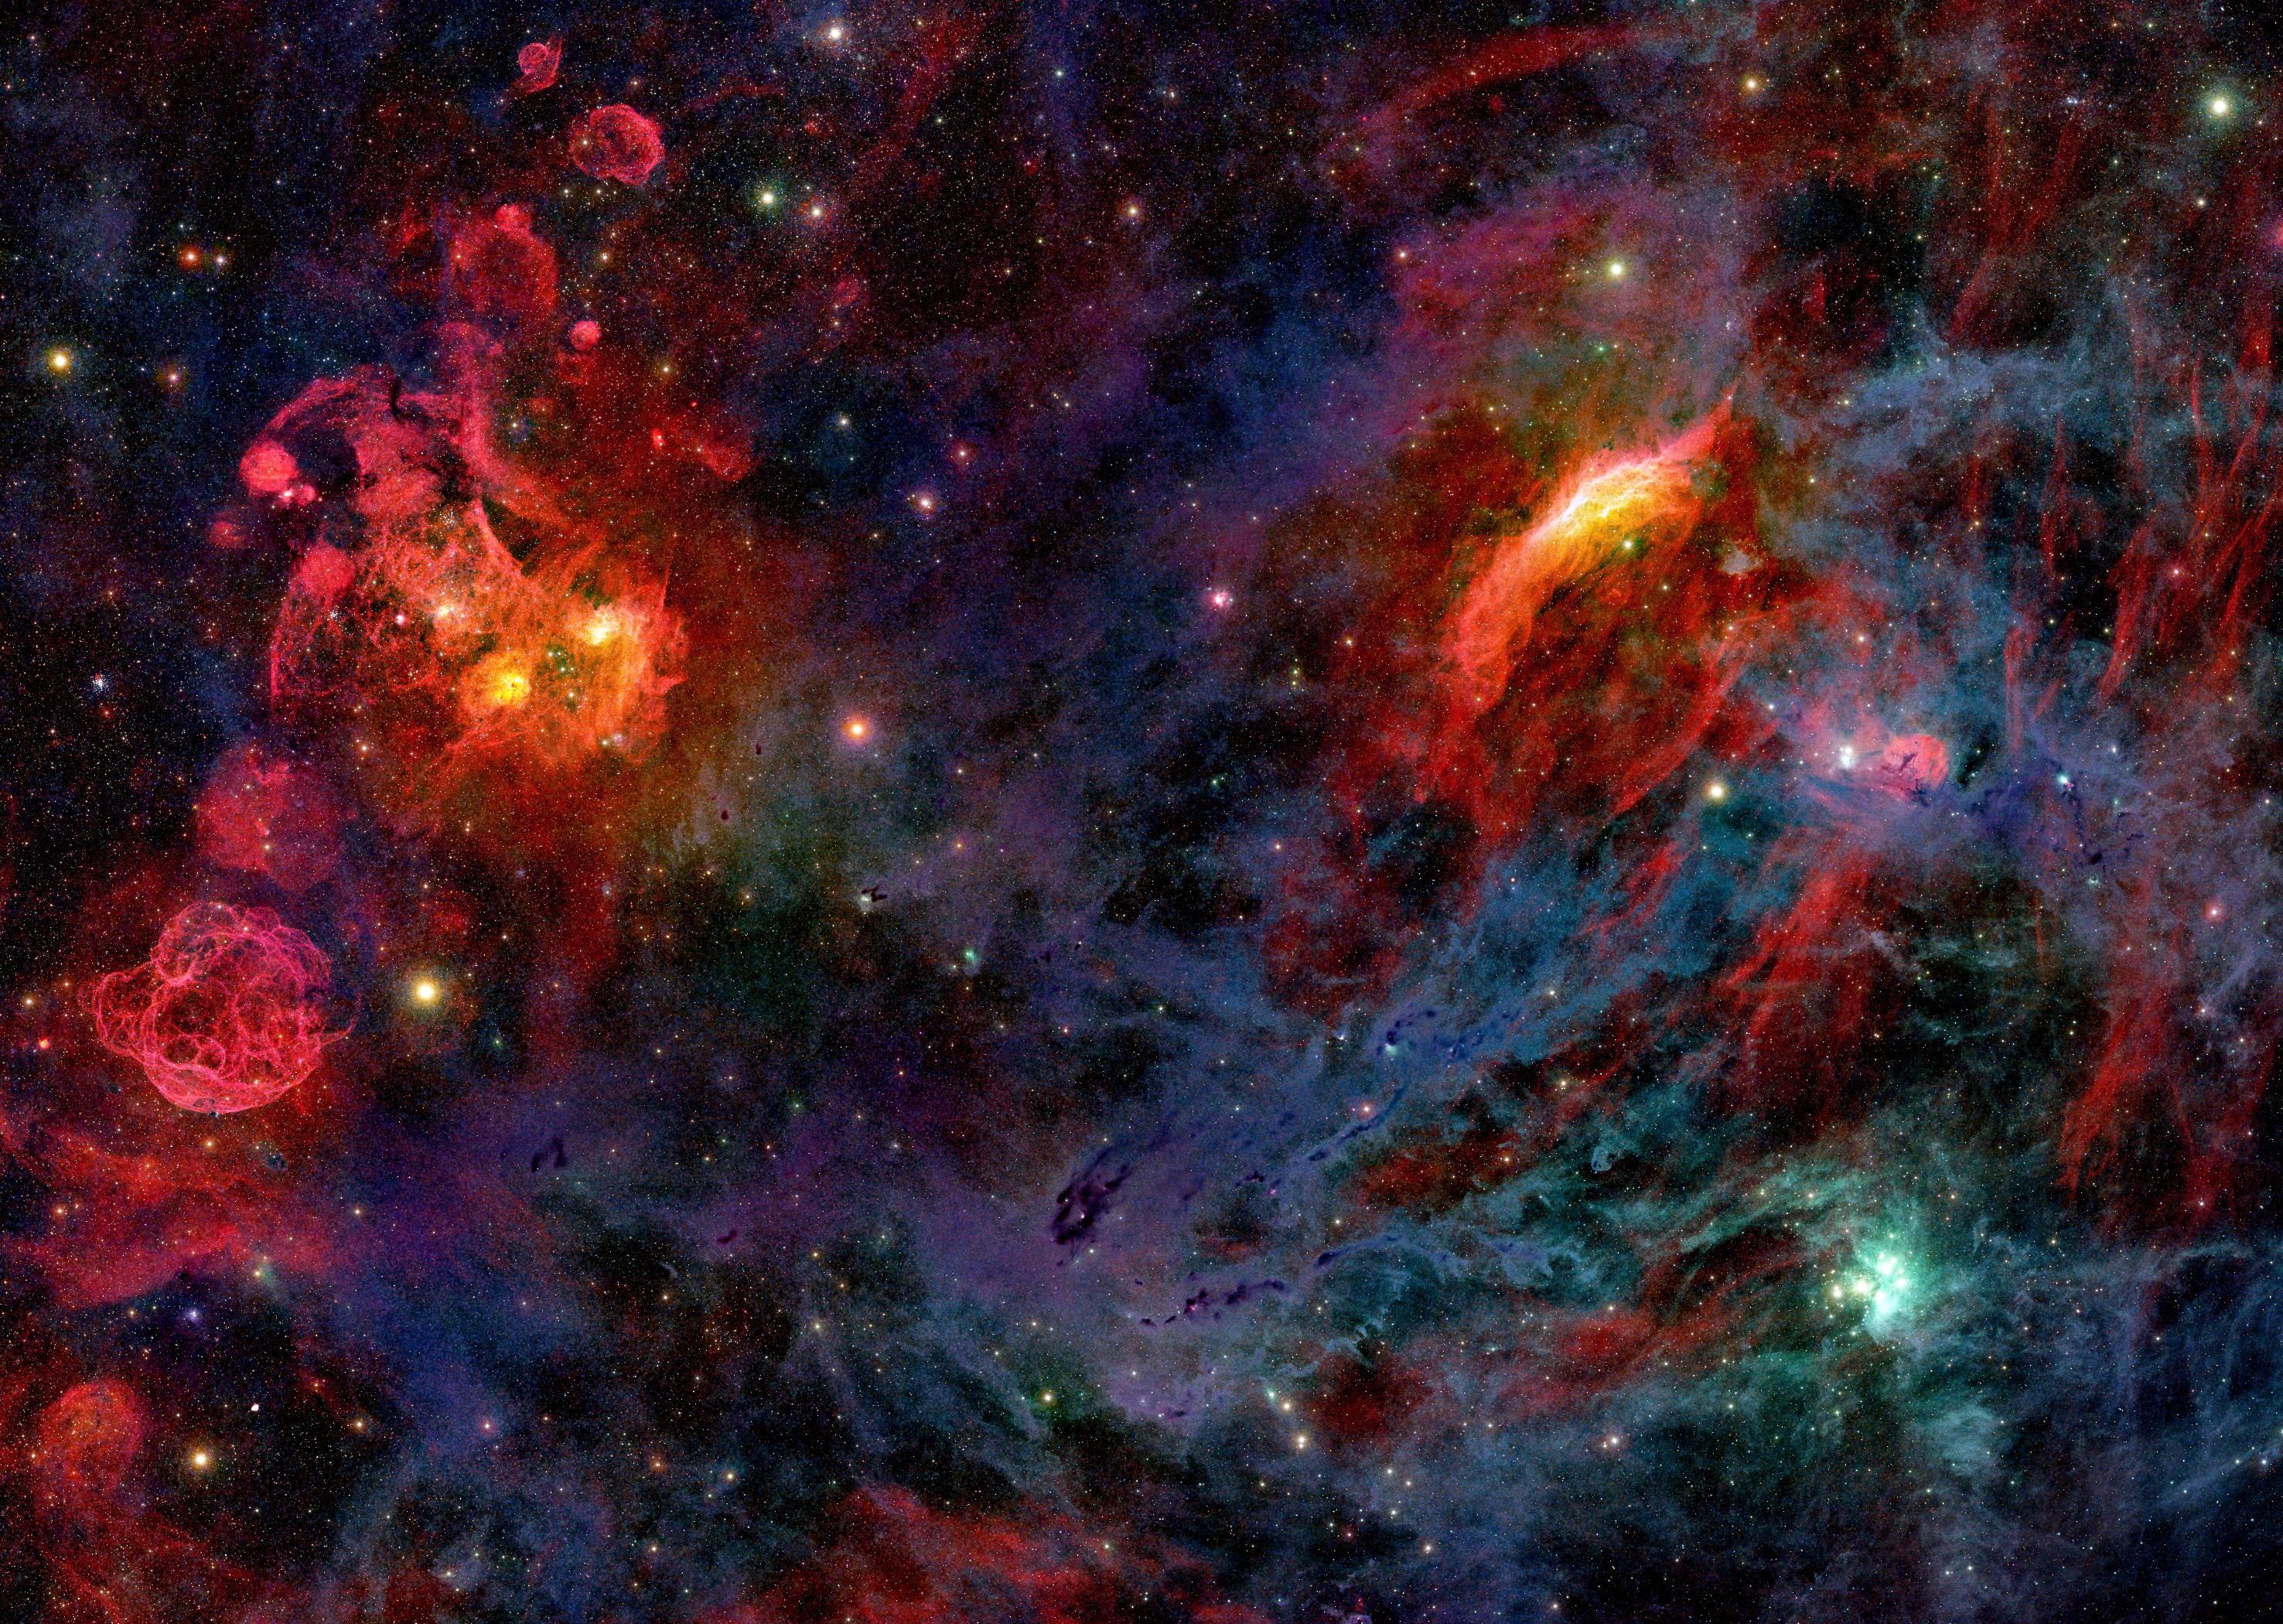
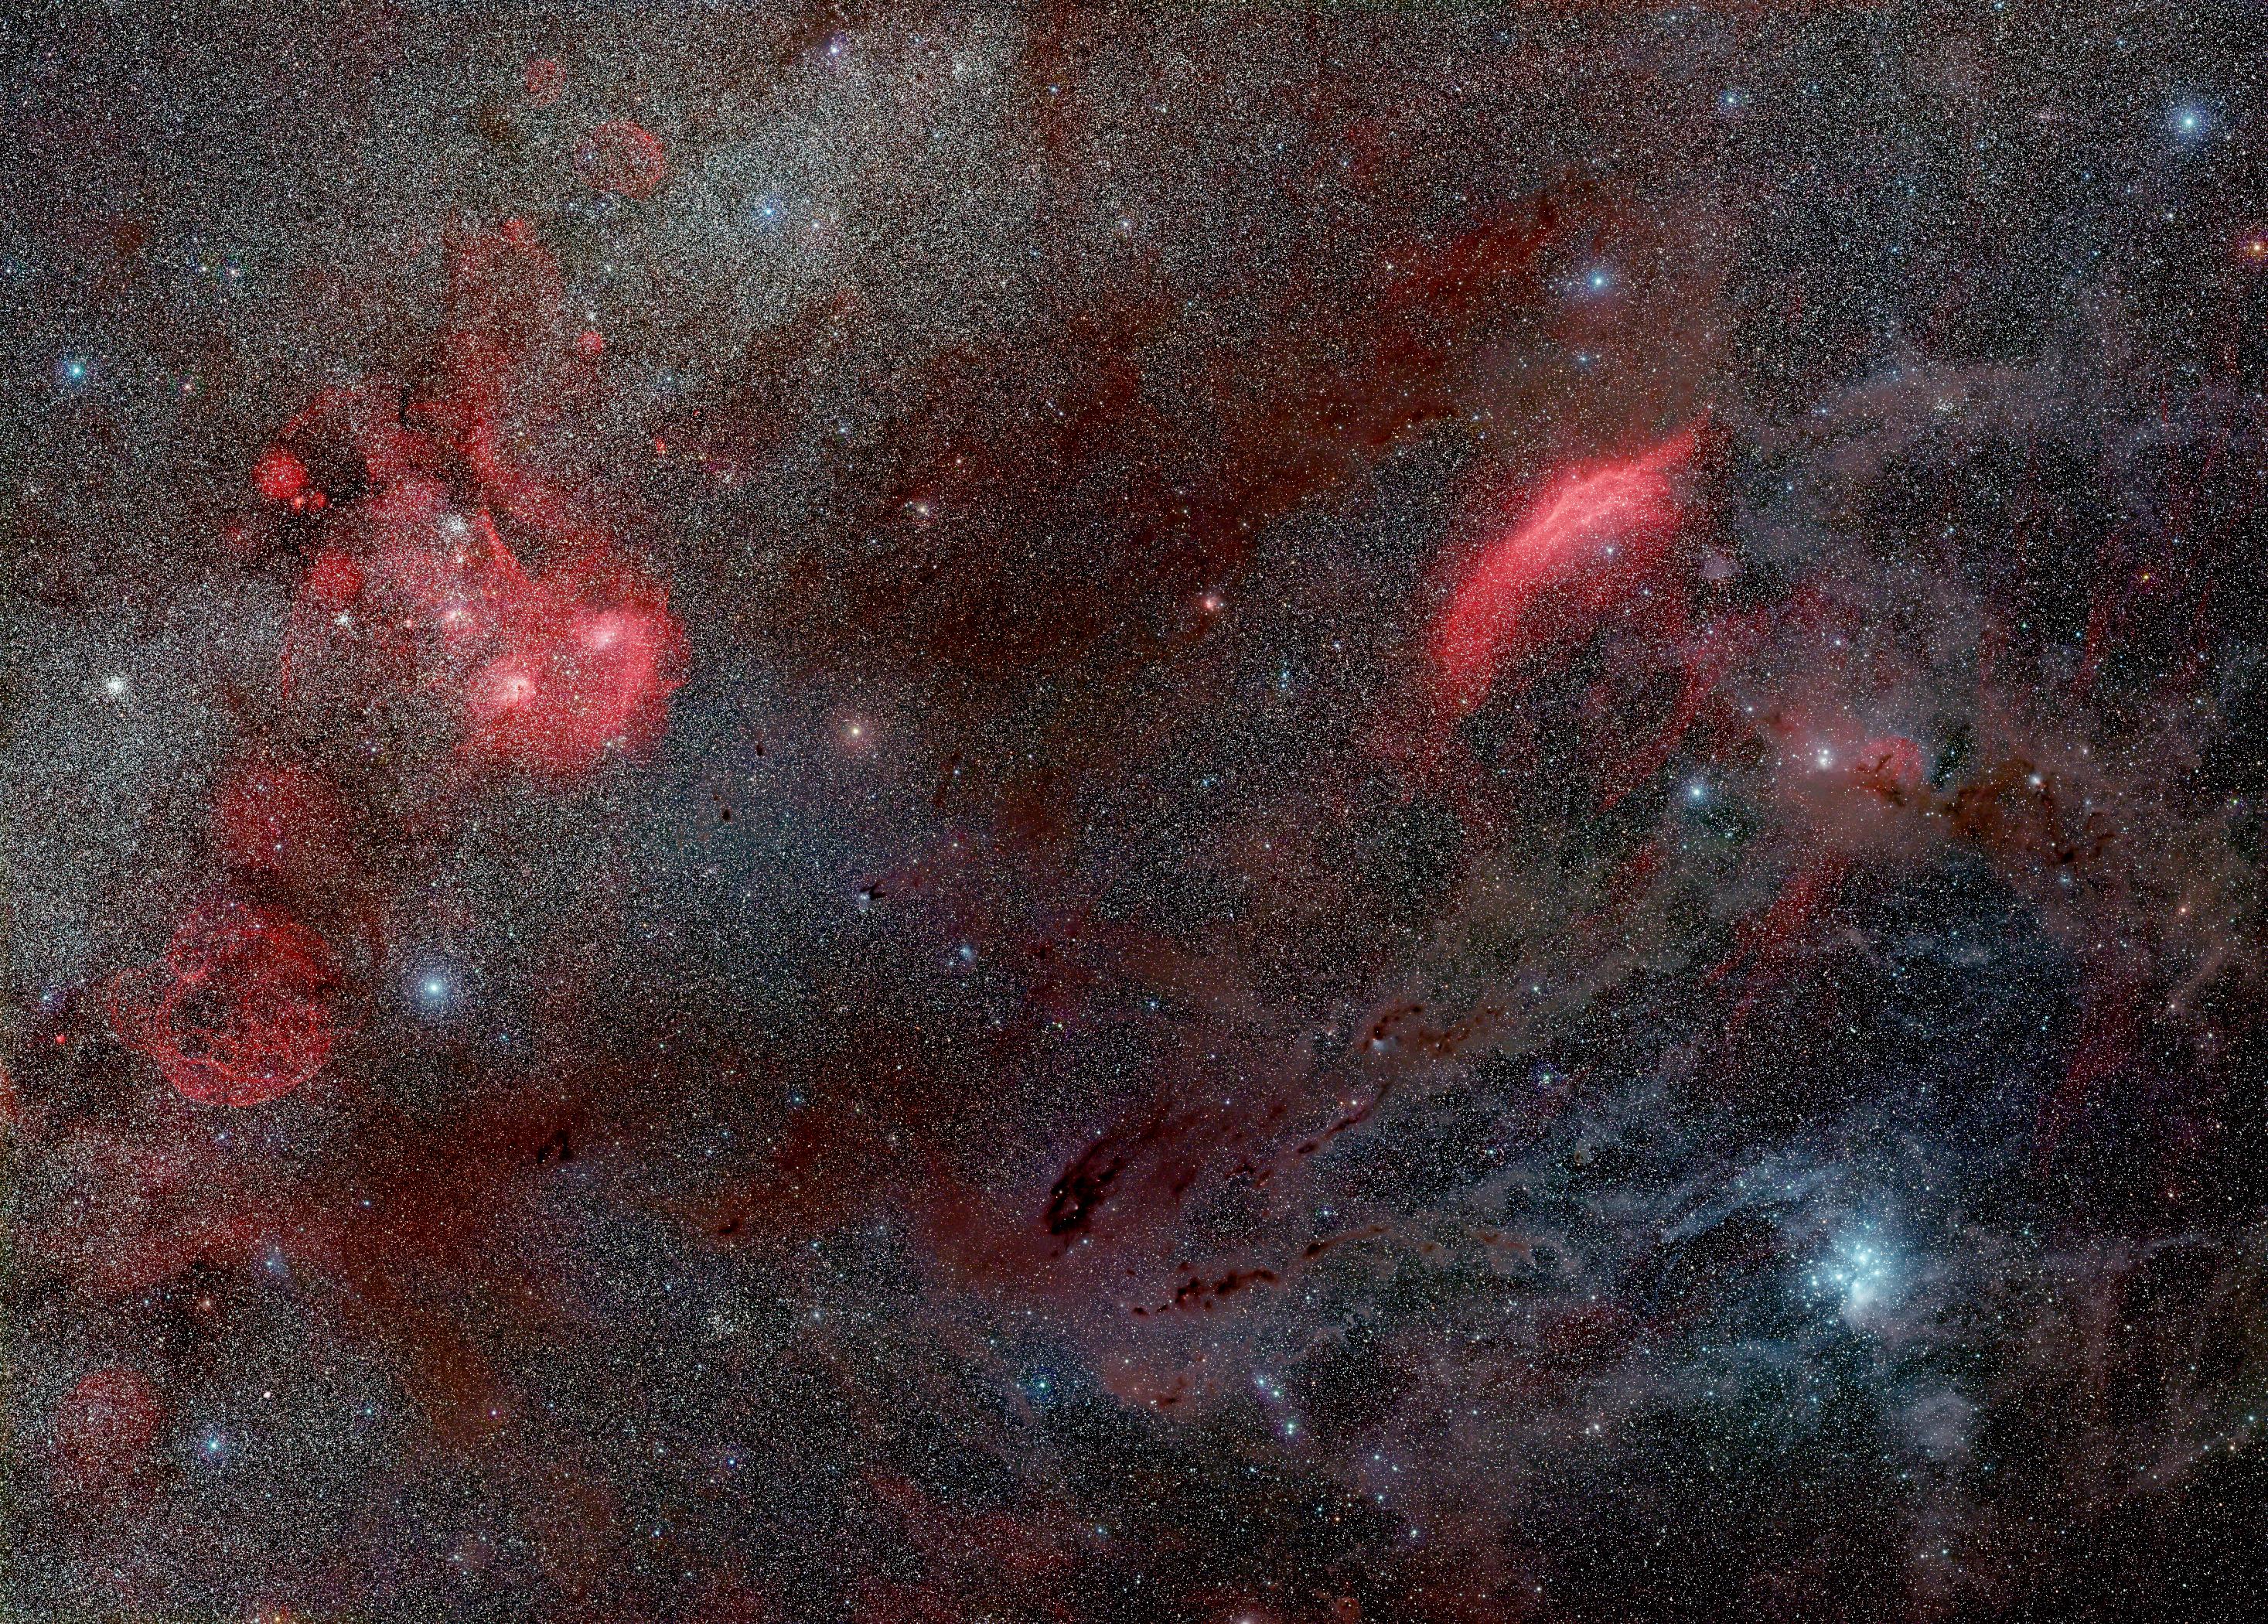
On this page a 25°×35° wide-field view of the Milky Way in the constellations Taurus, Auriga and Perseus is presented in different color composites. The region south of the galactic plane is full of Molecular clouds.
The pictures below are downscaled versions. Full resolution images with more than 100 megapixels can be loaded with a Javascript viewer by clicking on the images in the first section. Selected details are shown in the second section. The third section presents some discoveries. Image and instrument data can be found at the end of this page.
Full views
Click on the images to load a full resolution version with more than 100 megapixels using a JavaScript viewer.
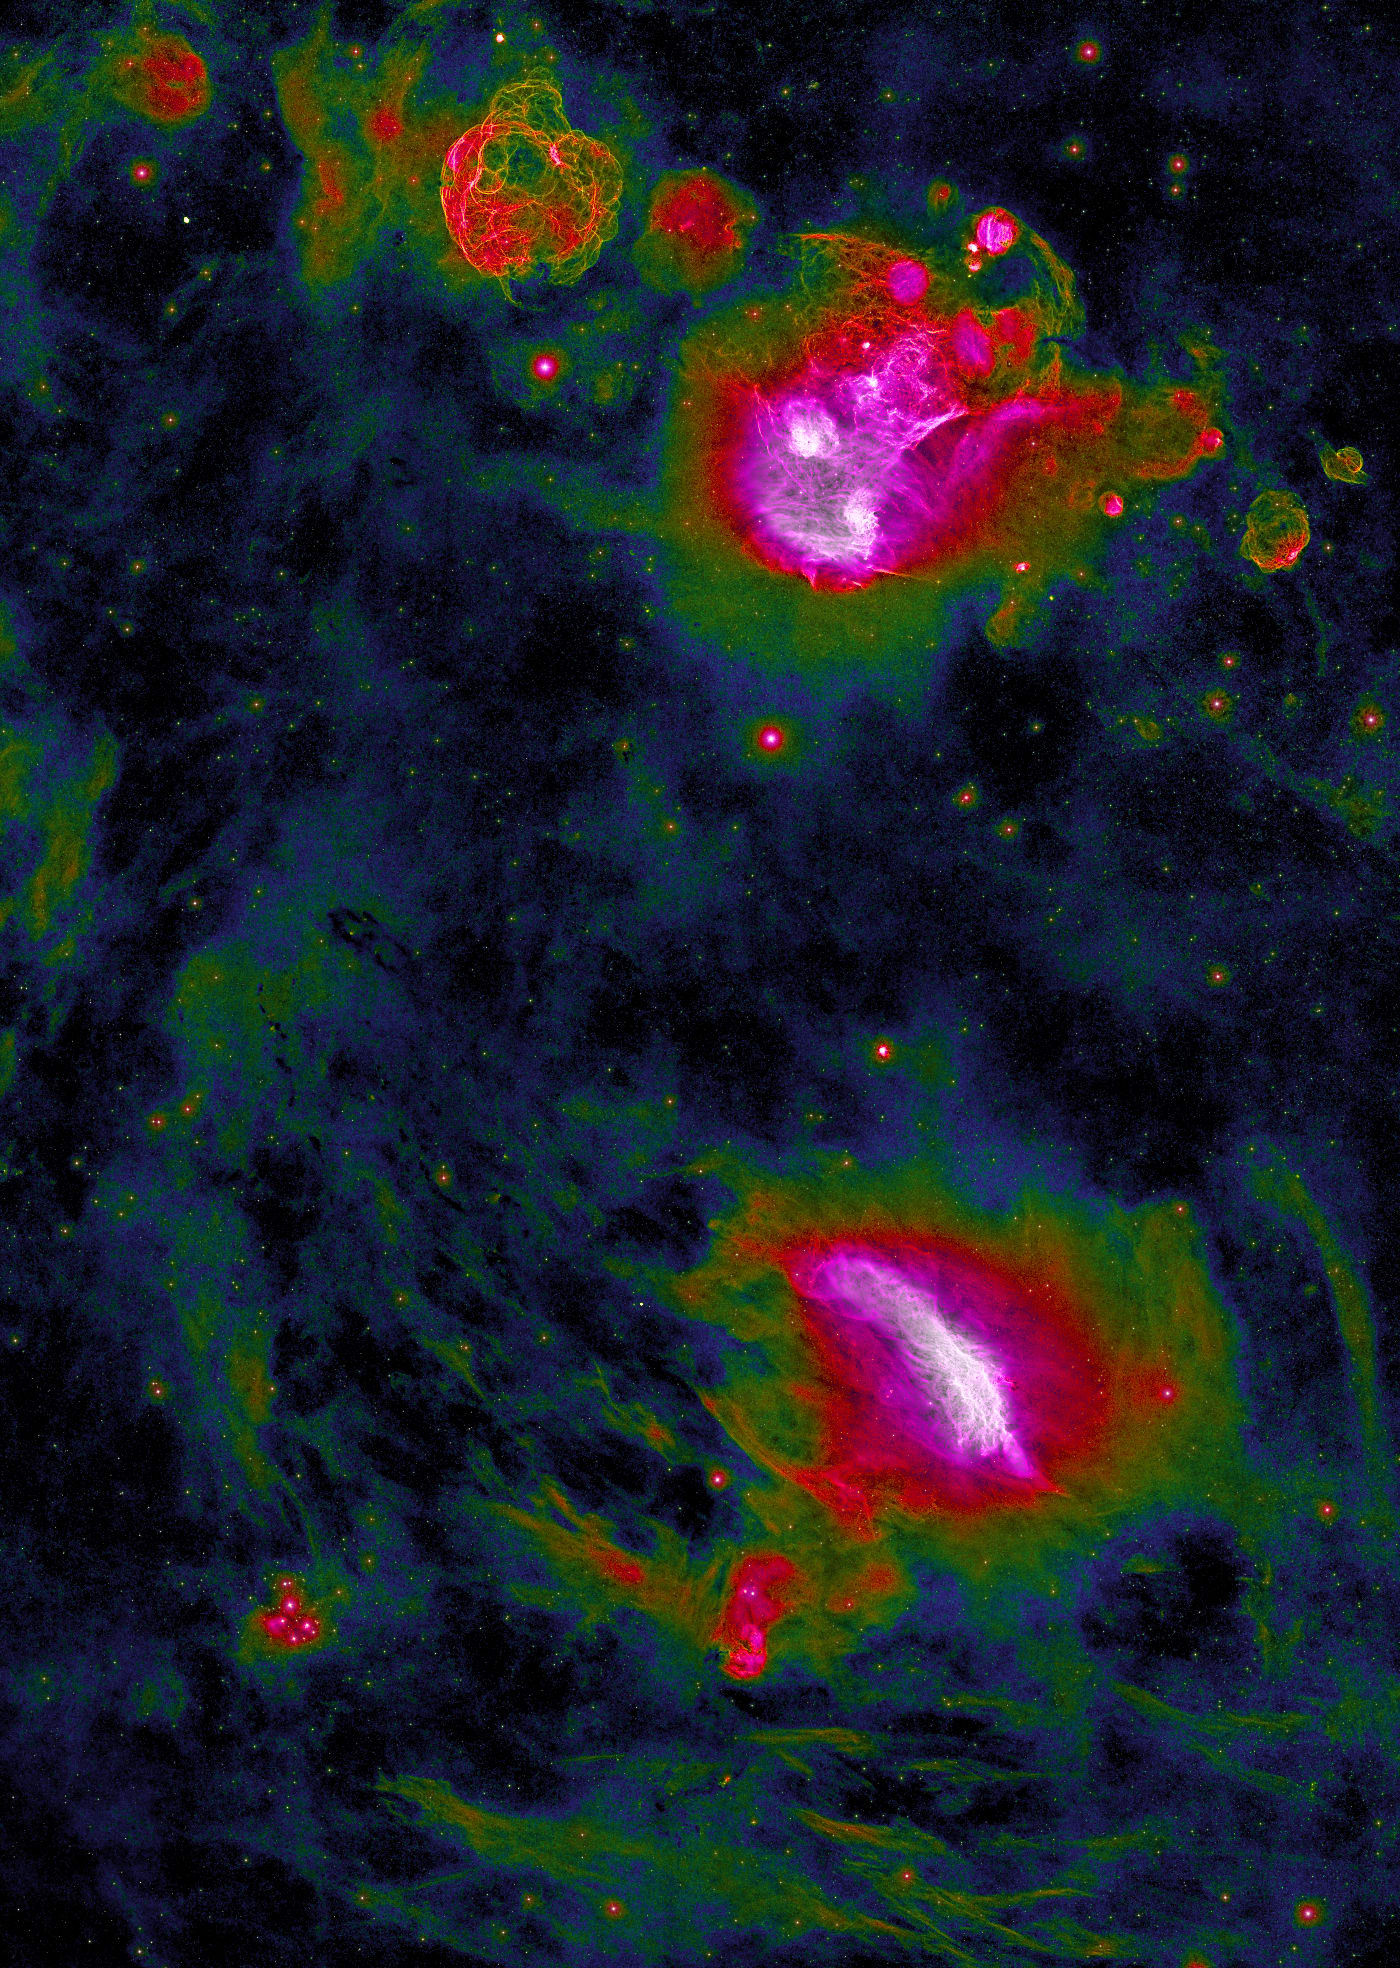

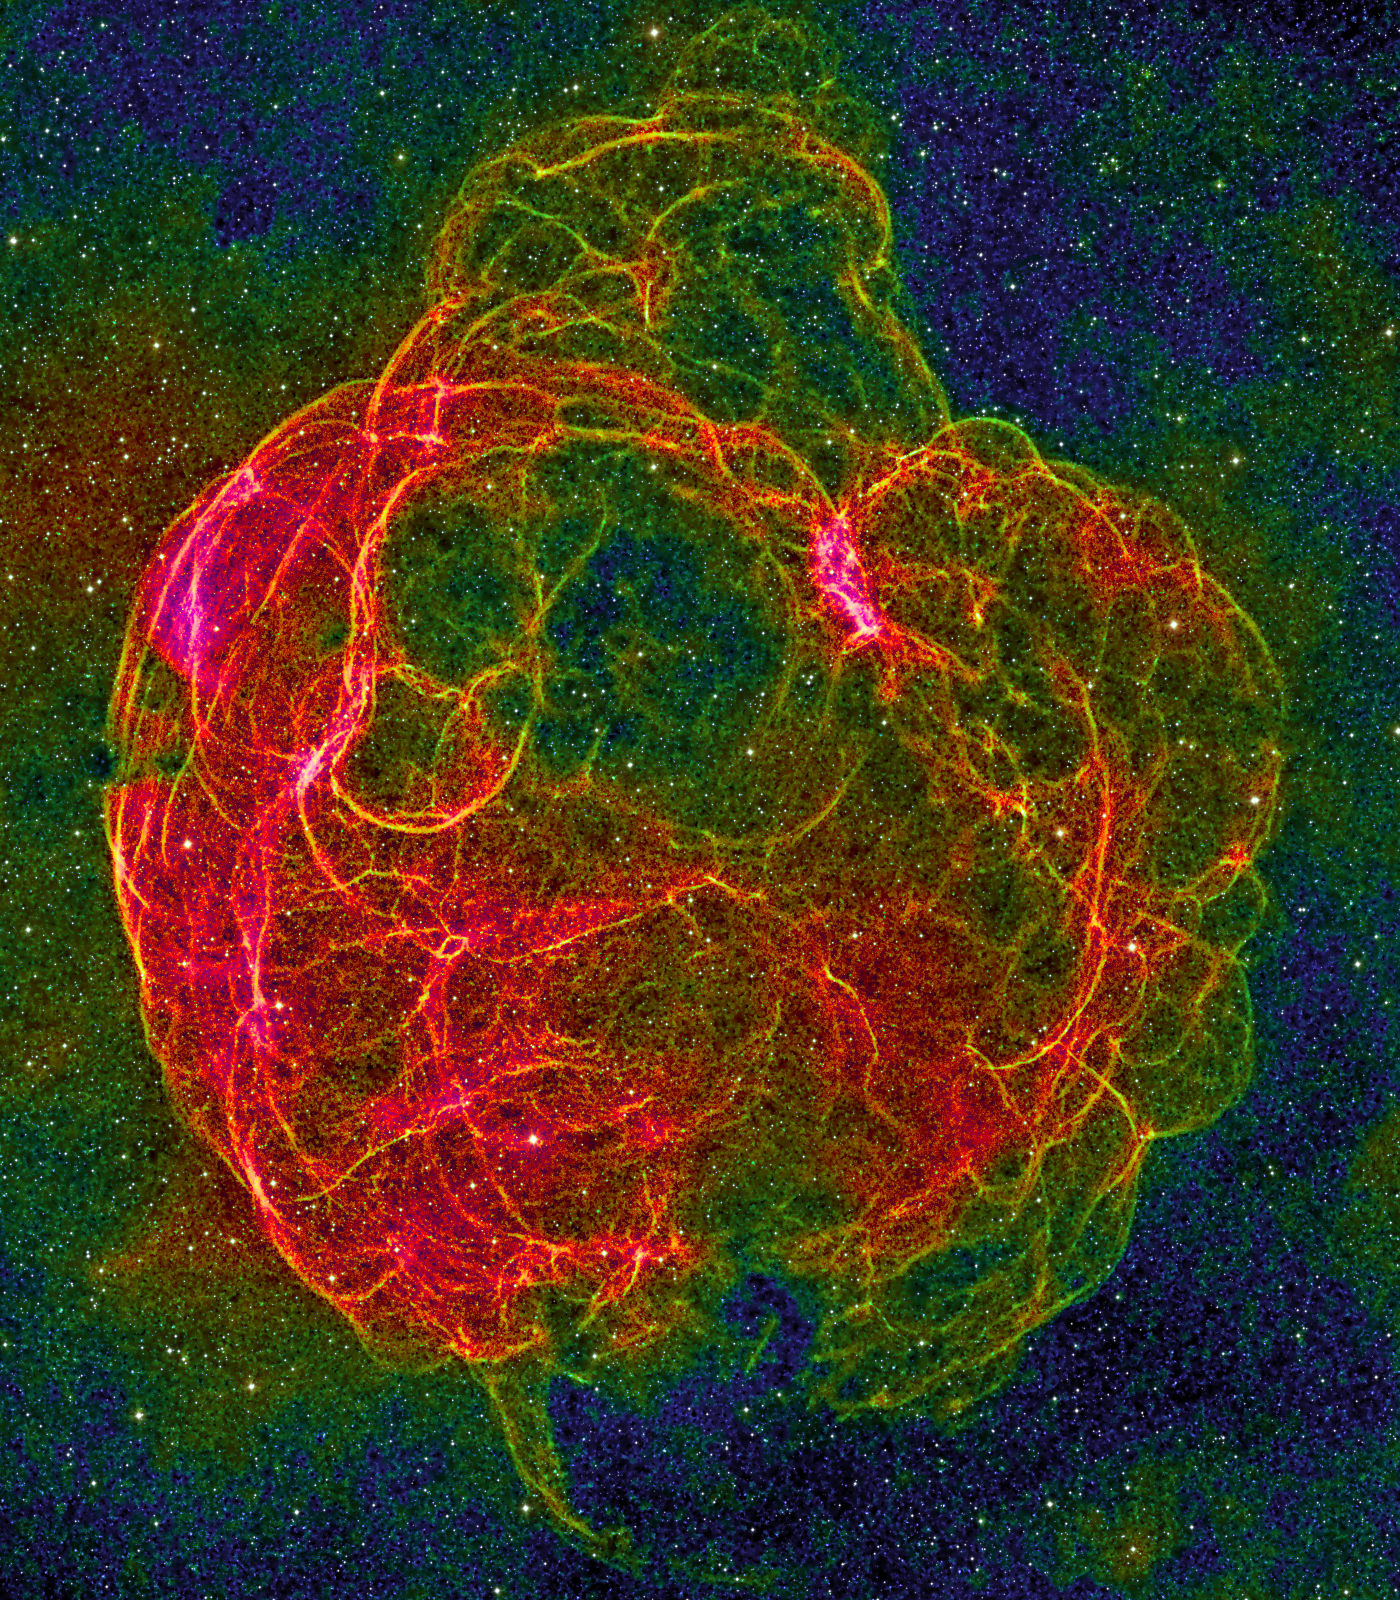
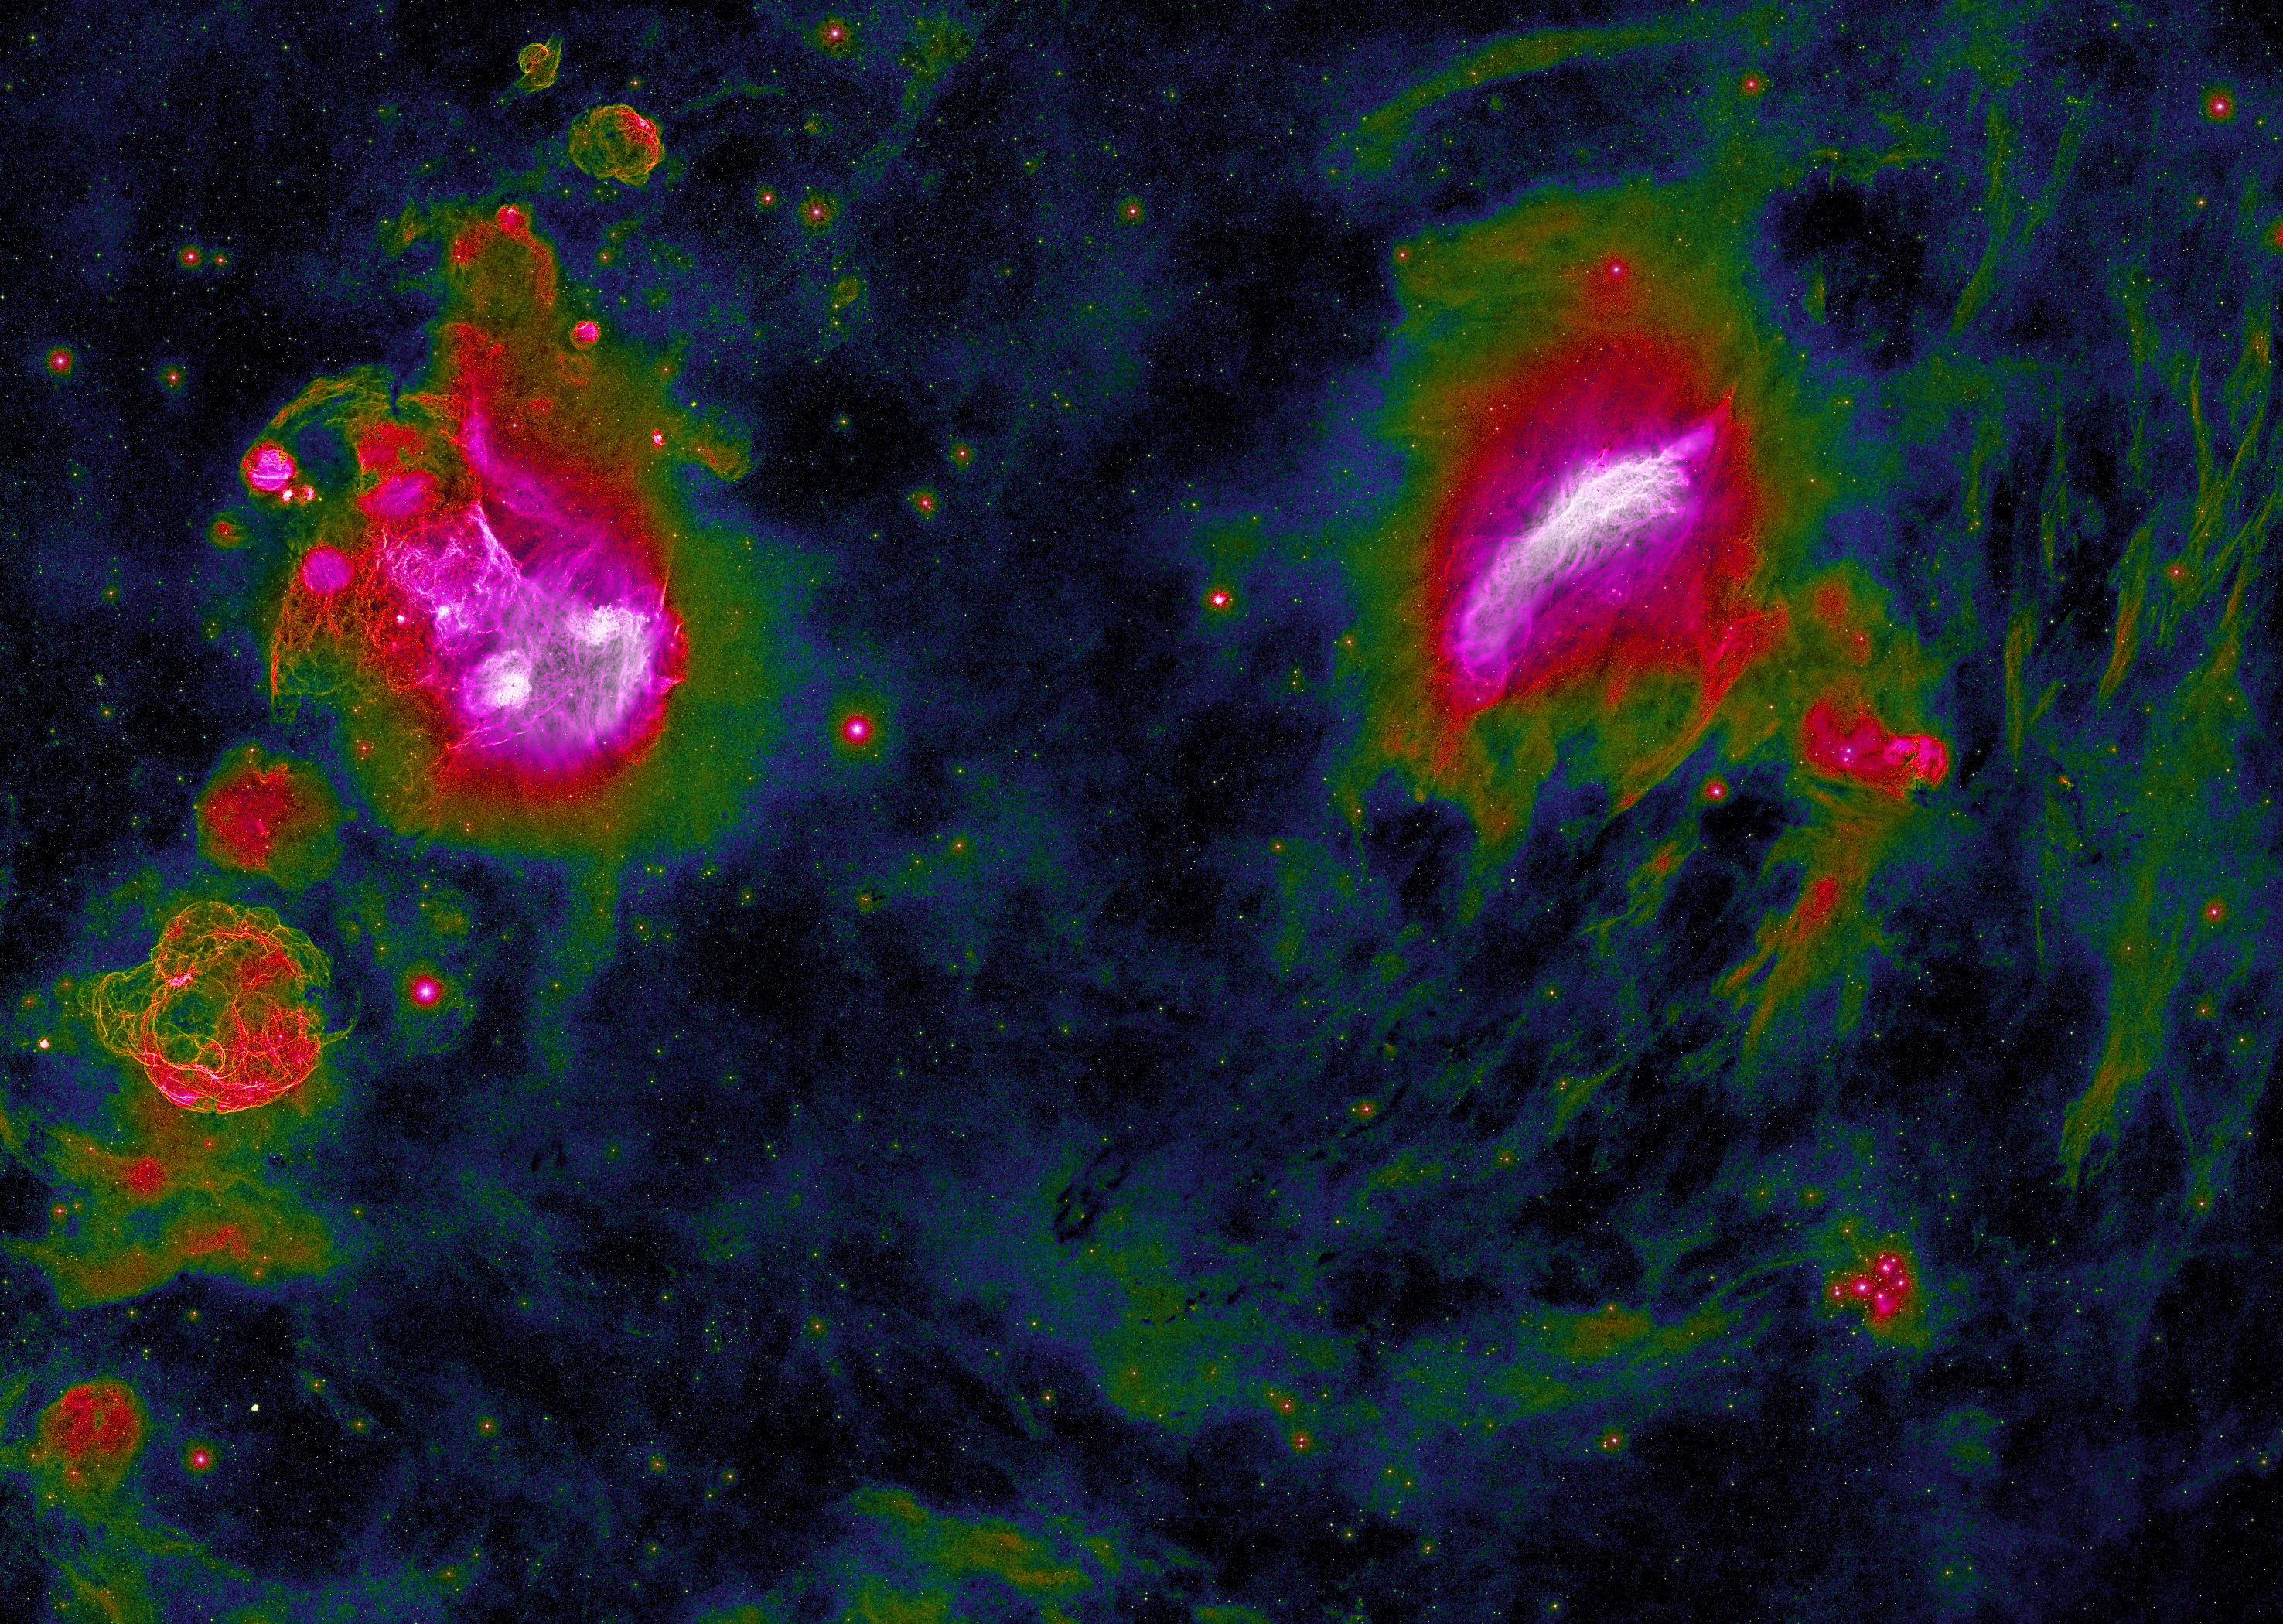
This visualization is a pseudo-color image that only uses the H-alpha data (including some red continuum). It shows many more details of the emission nebulae than the image above.
Color composition: After partial star subtraction, the dynamic range was compressed using a non-linear high-pass filter. This results in a compression ratio r, which is used to calculate the color as depicted in the legend.
(The legend shows the compression c:=1-r). Blue regions are compressed the least, while white regions are compressed the most. Luminance is determined by the tonal curve-corrected result of the dynamic range compression.
Due to the limited resolution of continuum channels, the image is only presented at half resolution.
Selected details
Here are a few details that also can be seen using the JavaScript viewer.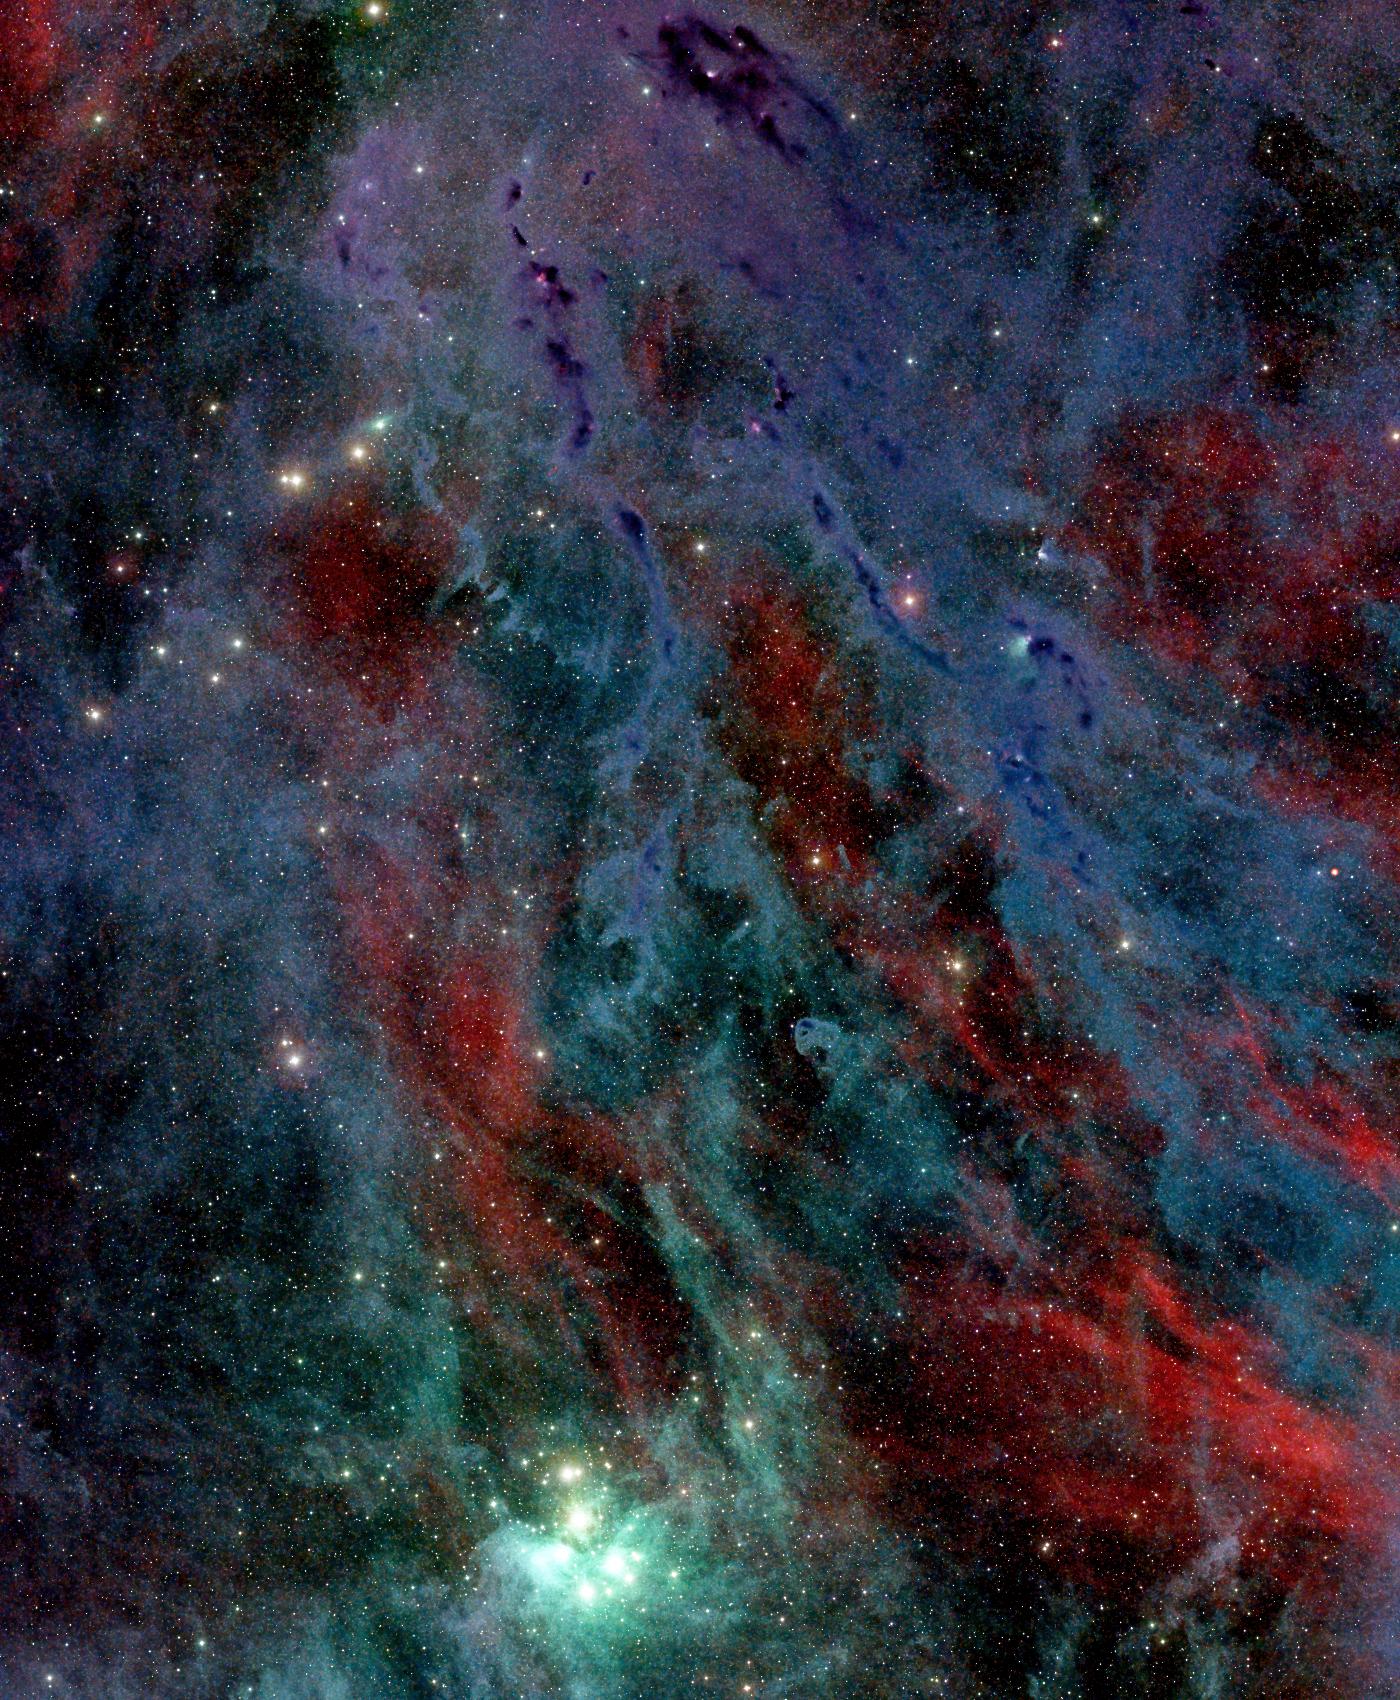
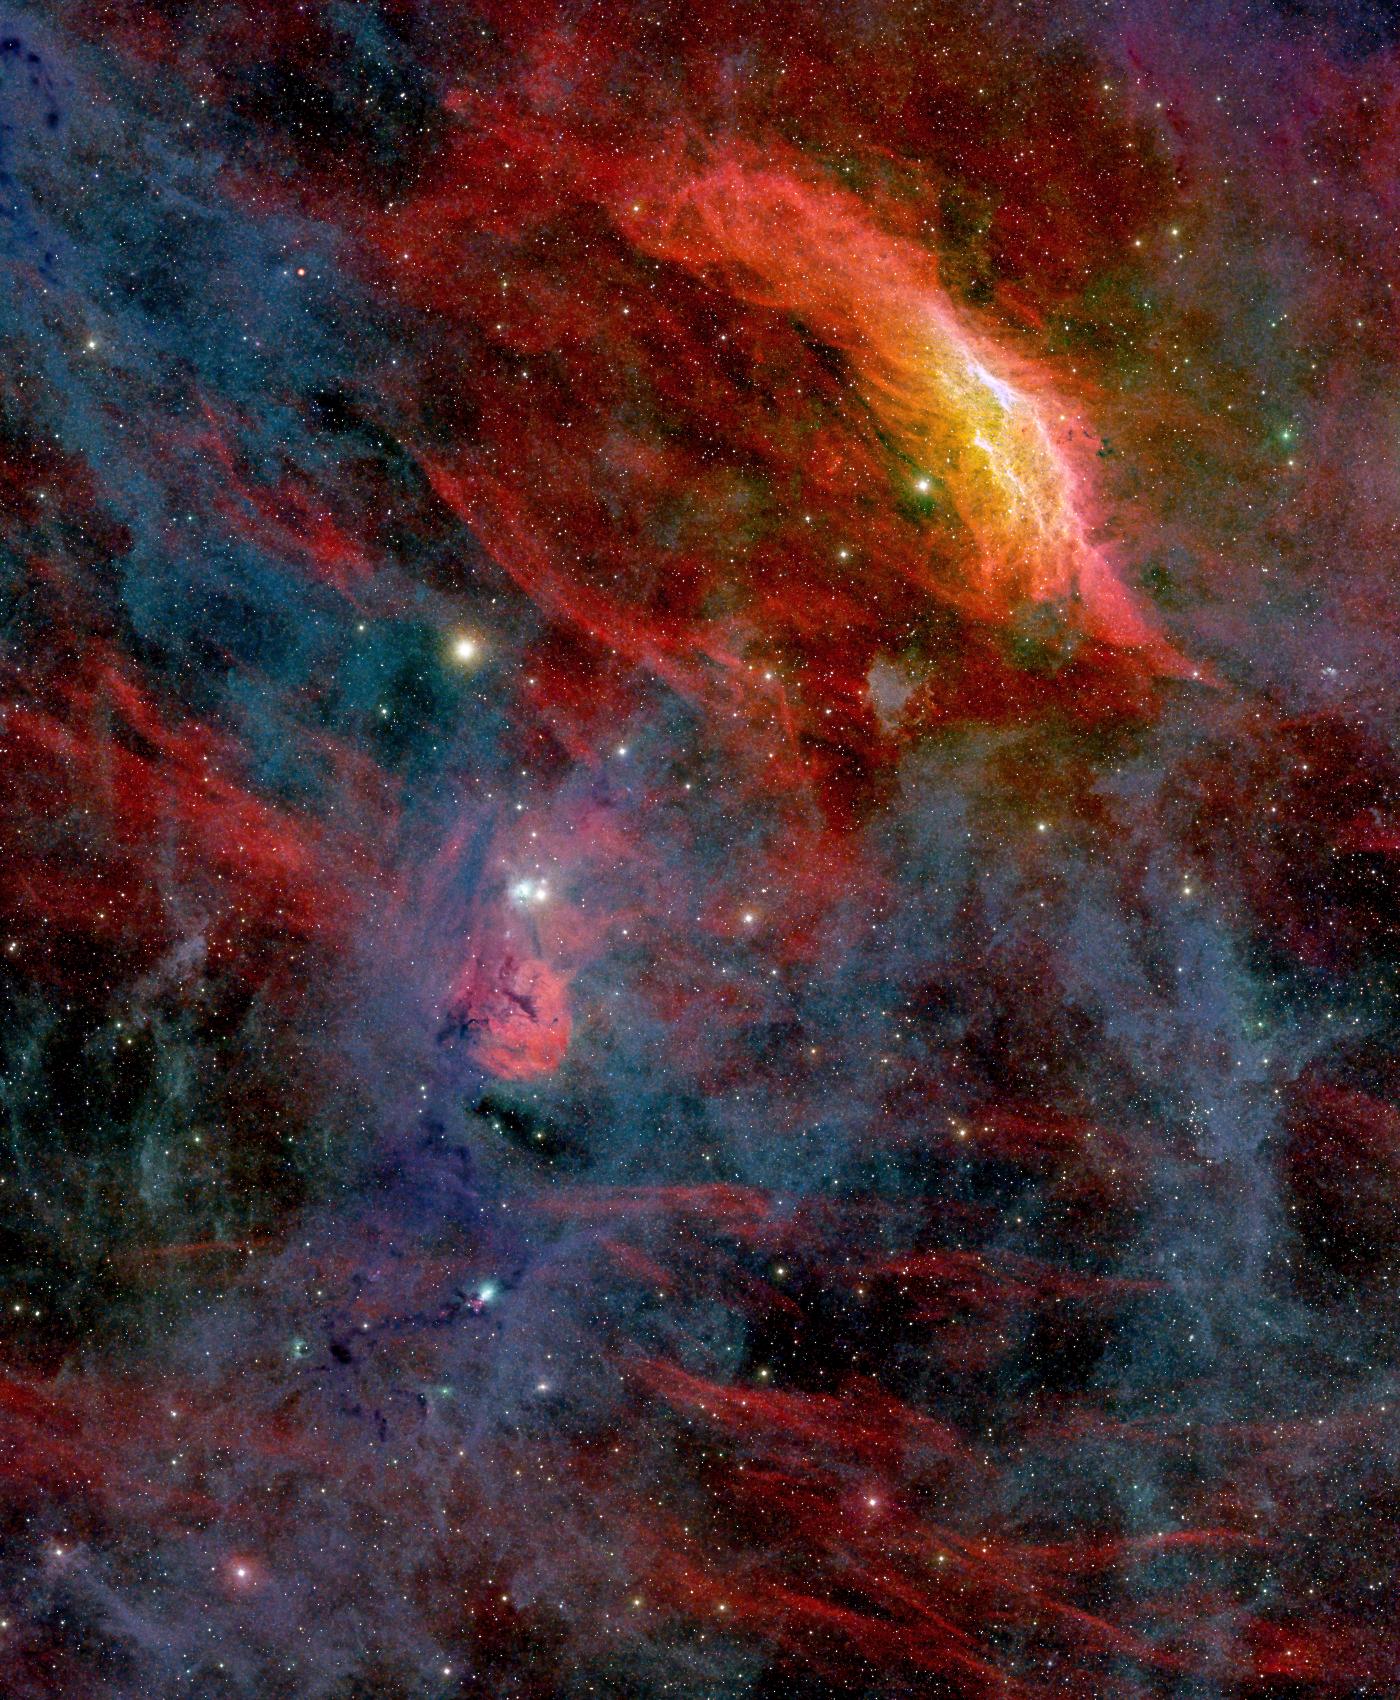
These molecular clouds partly obscure a huge HII region (red) which brightest part seems to be the California Nebula (NGC 1499). That structure is analyzed in detail at separate page: HII region around California Nebula (NGC 1499).
Discoveries
The views above show many nebulae that cannot be found in catalogs. (The JavaScript Viewer allows identifying objects using catalogs or SIMBAD and defining new objects.) Some (probably not all) of these unexplored nebulae have been collected in the list below. Click on the following links for a presentation.- Objects that are not cataloged by now and objects the are related to them. The list does not contain objects that are only minor extensions of known structures. For a detailed description of the object H1, also see the HII region around California Nebula (NGC 1499).
- Uncataloged HII rings and arcs. Some of these structures may be random, some may be projections of spherical shells (bubbles). Such structures are always circular in the image because stereographic projection was used. The outlines of these structures (all but CA1) are completed to circles. It may be helpful to toggle these plots on and off by pressing the '2' key in order to improve the visibility.
- In the JavaScript viewer, the object outlines can be toggled on and off by pressing the '2' key. This can be helpful to make certain structures (e.g. rings) visible.
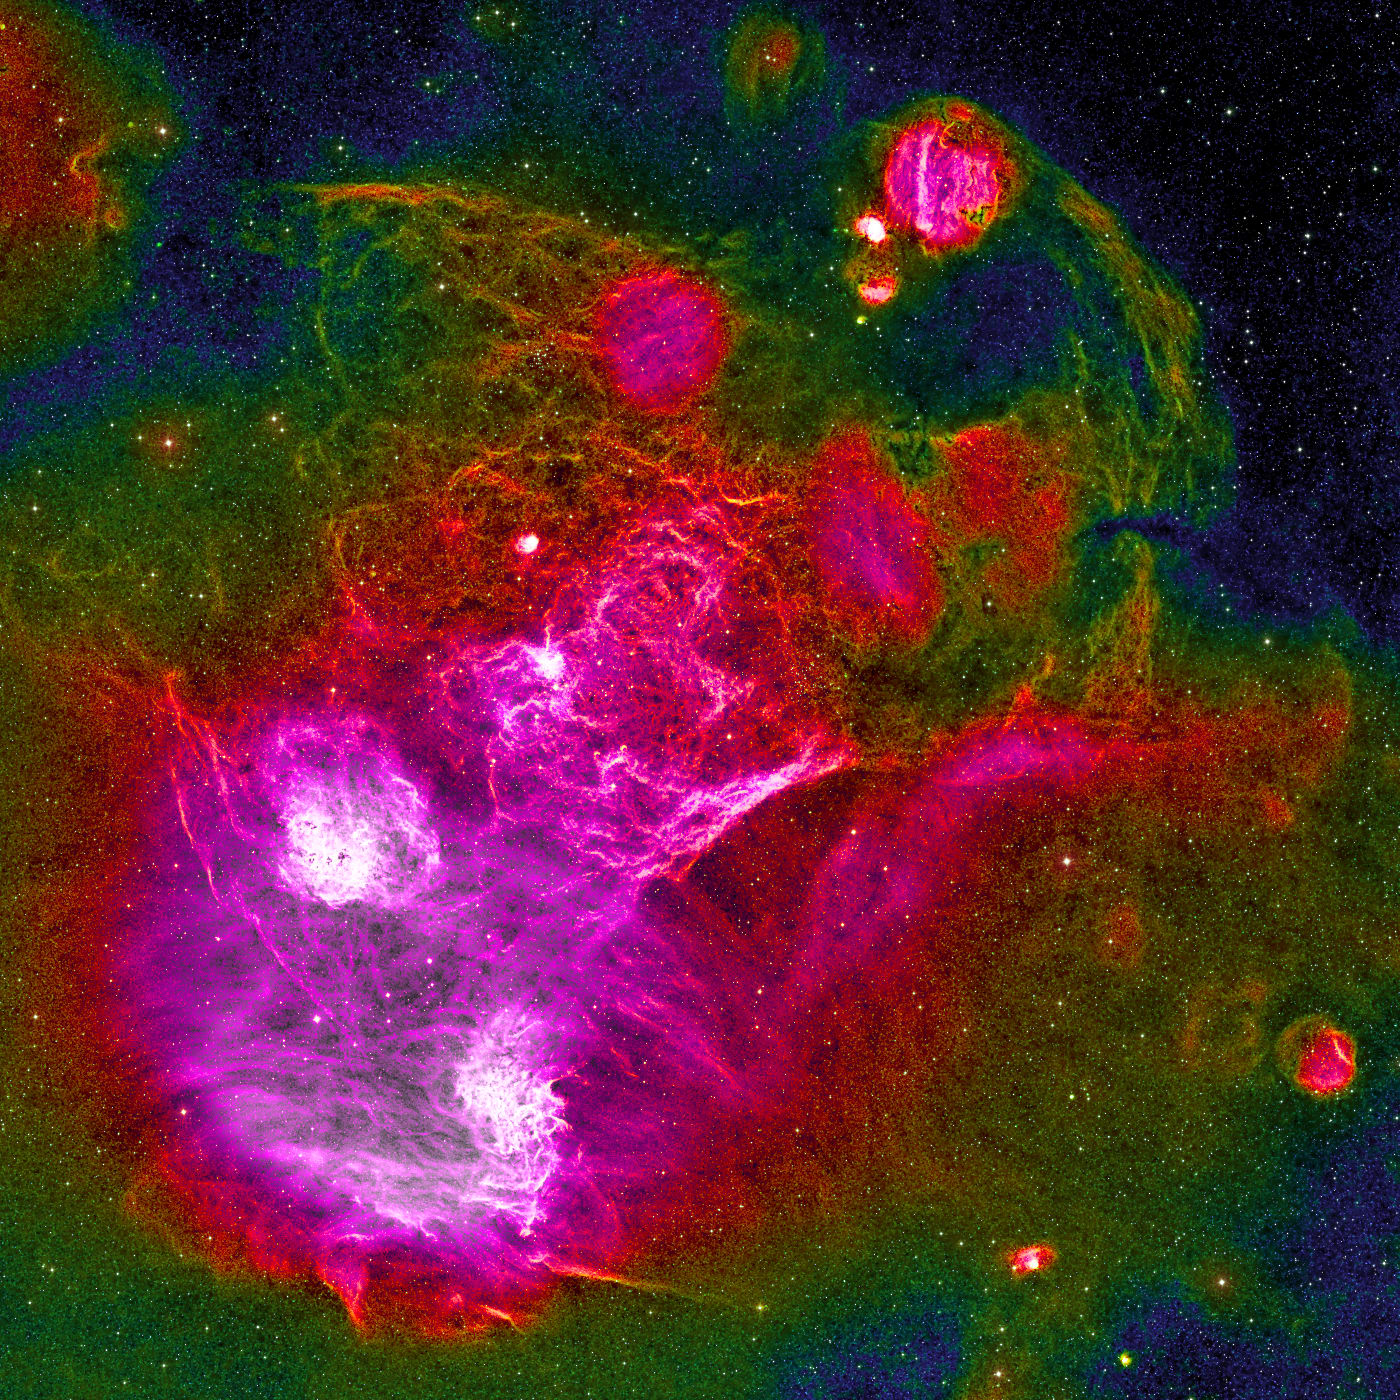
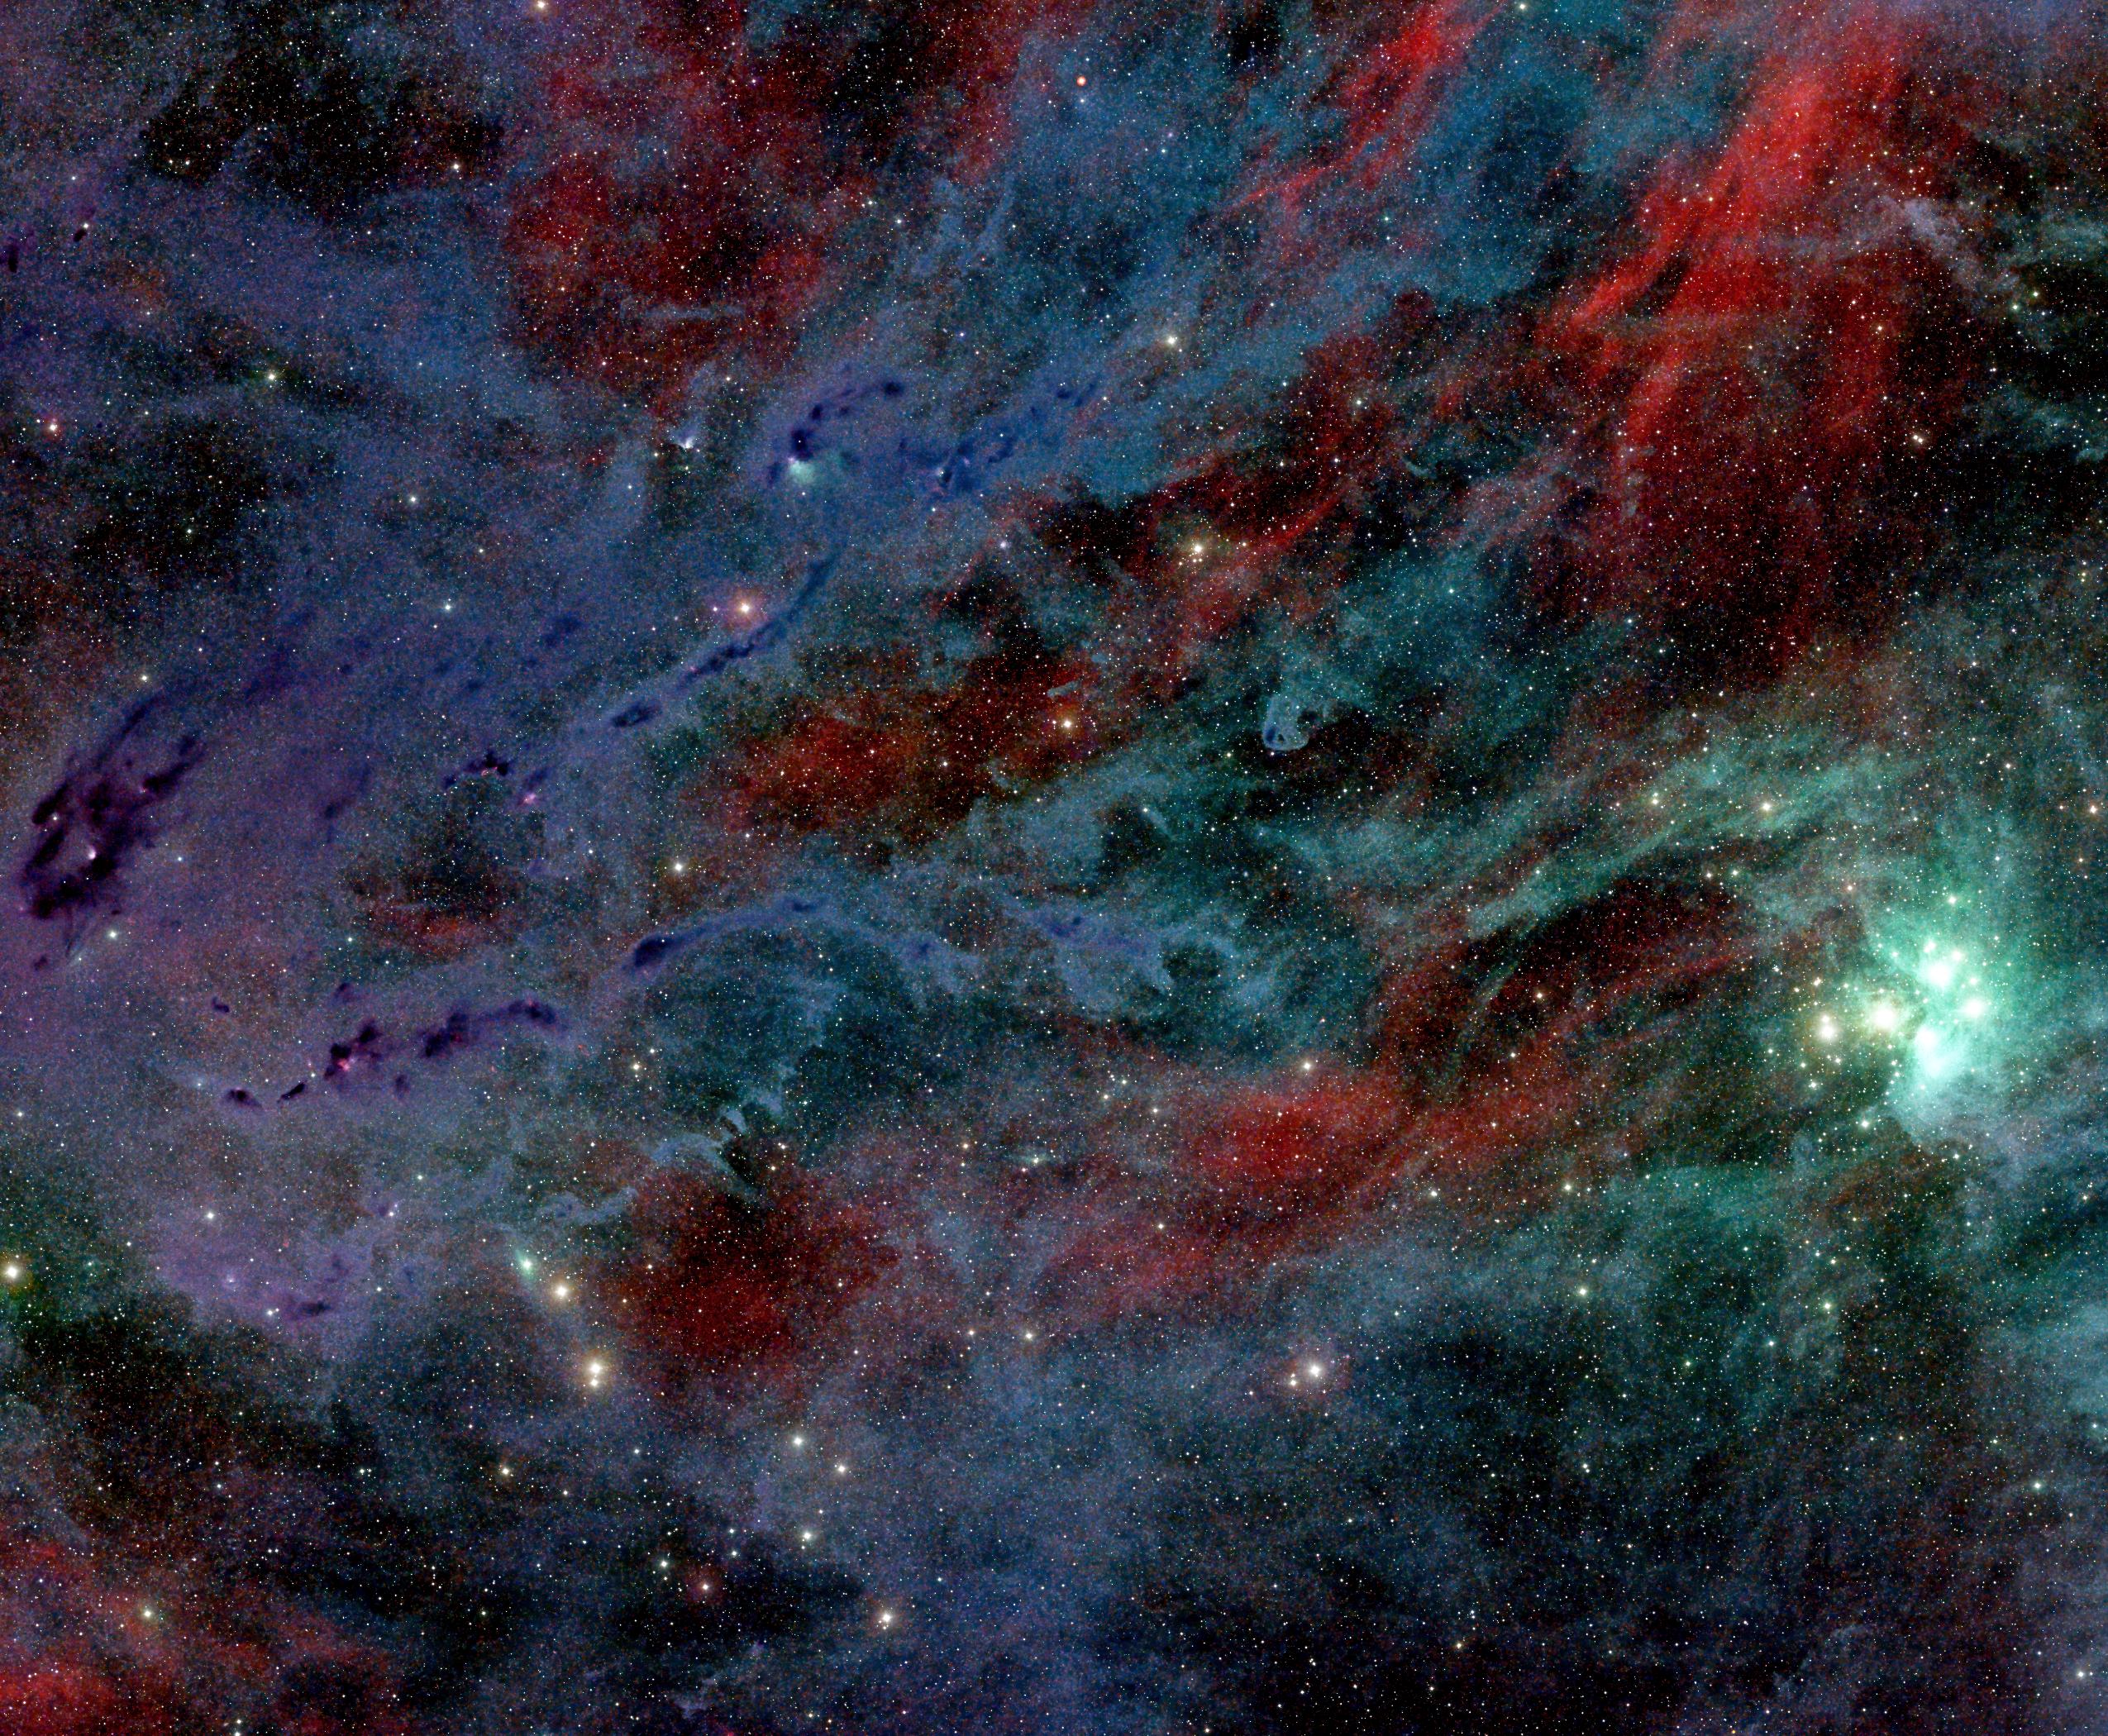
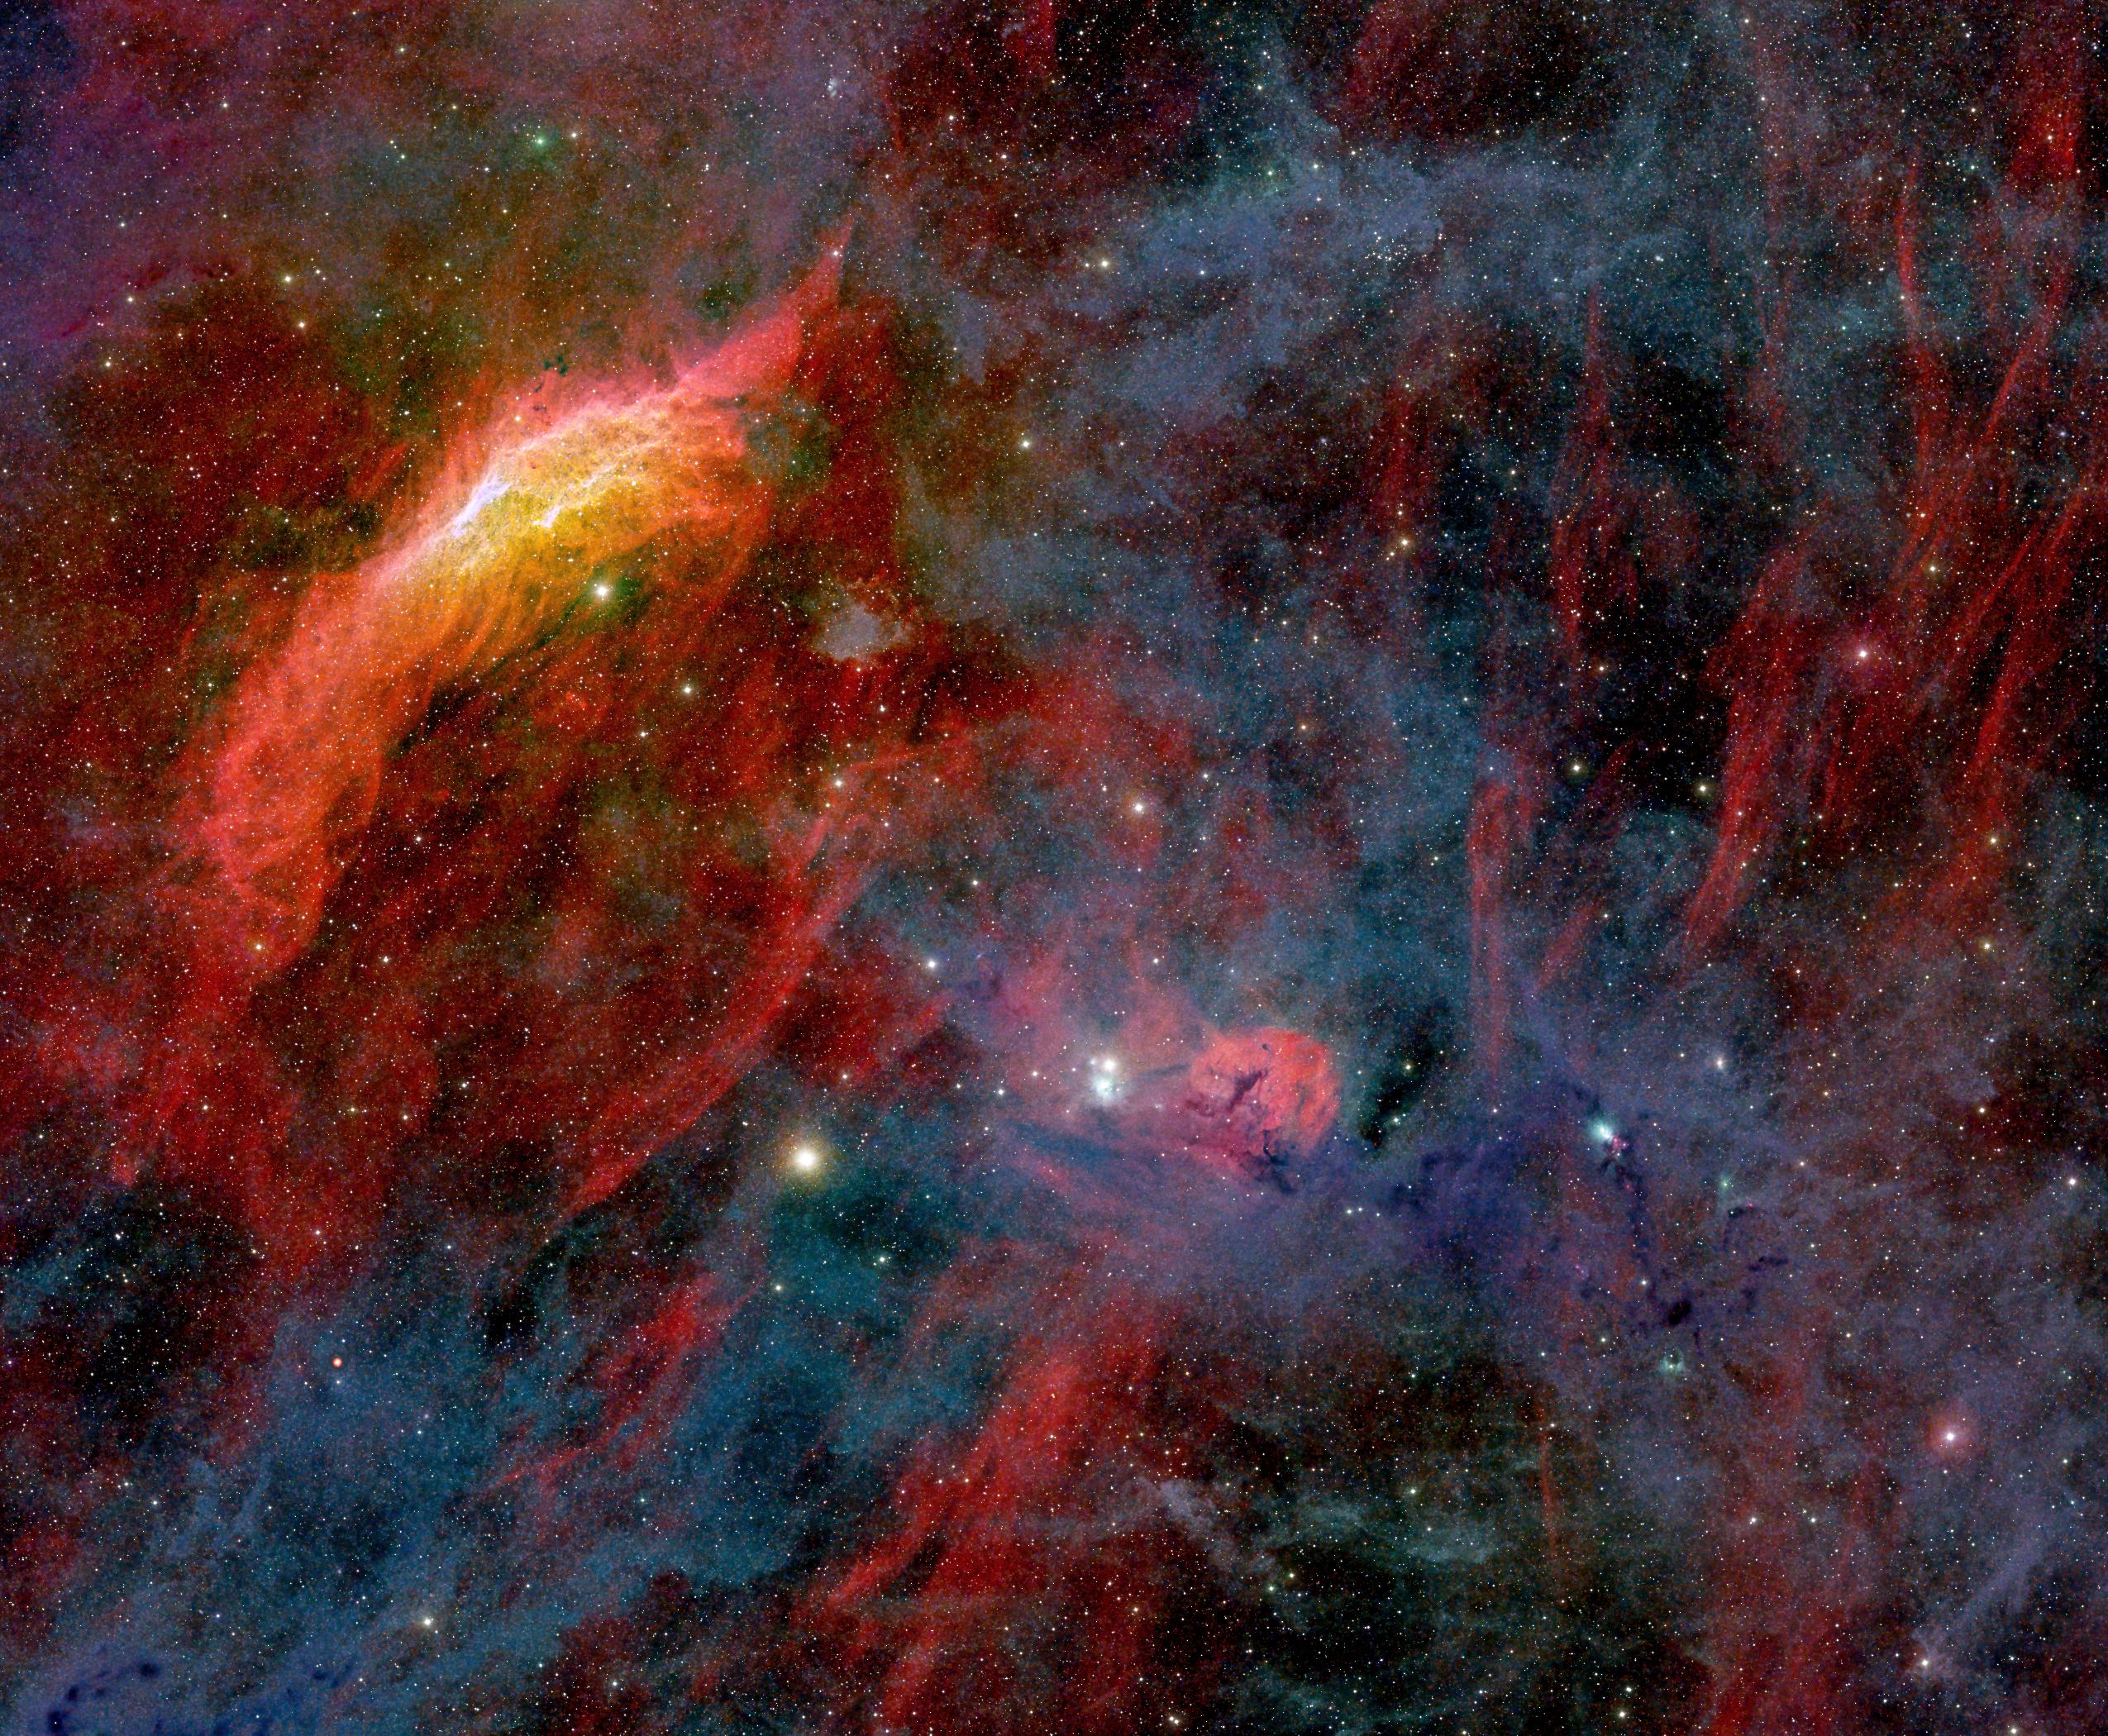
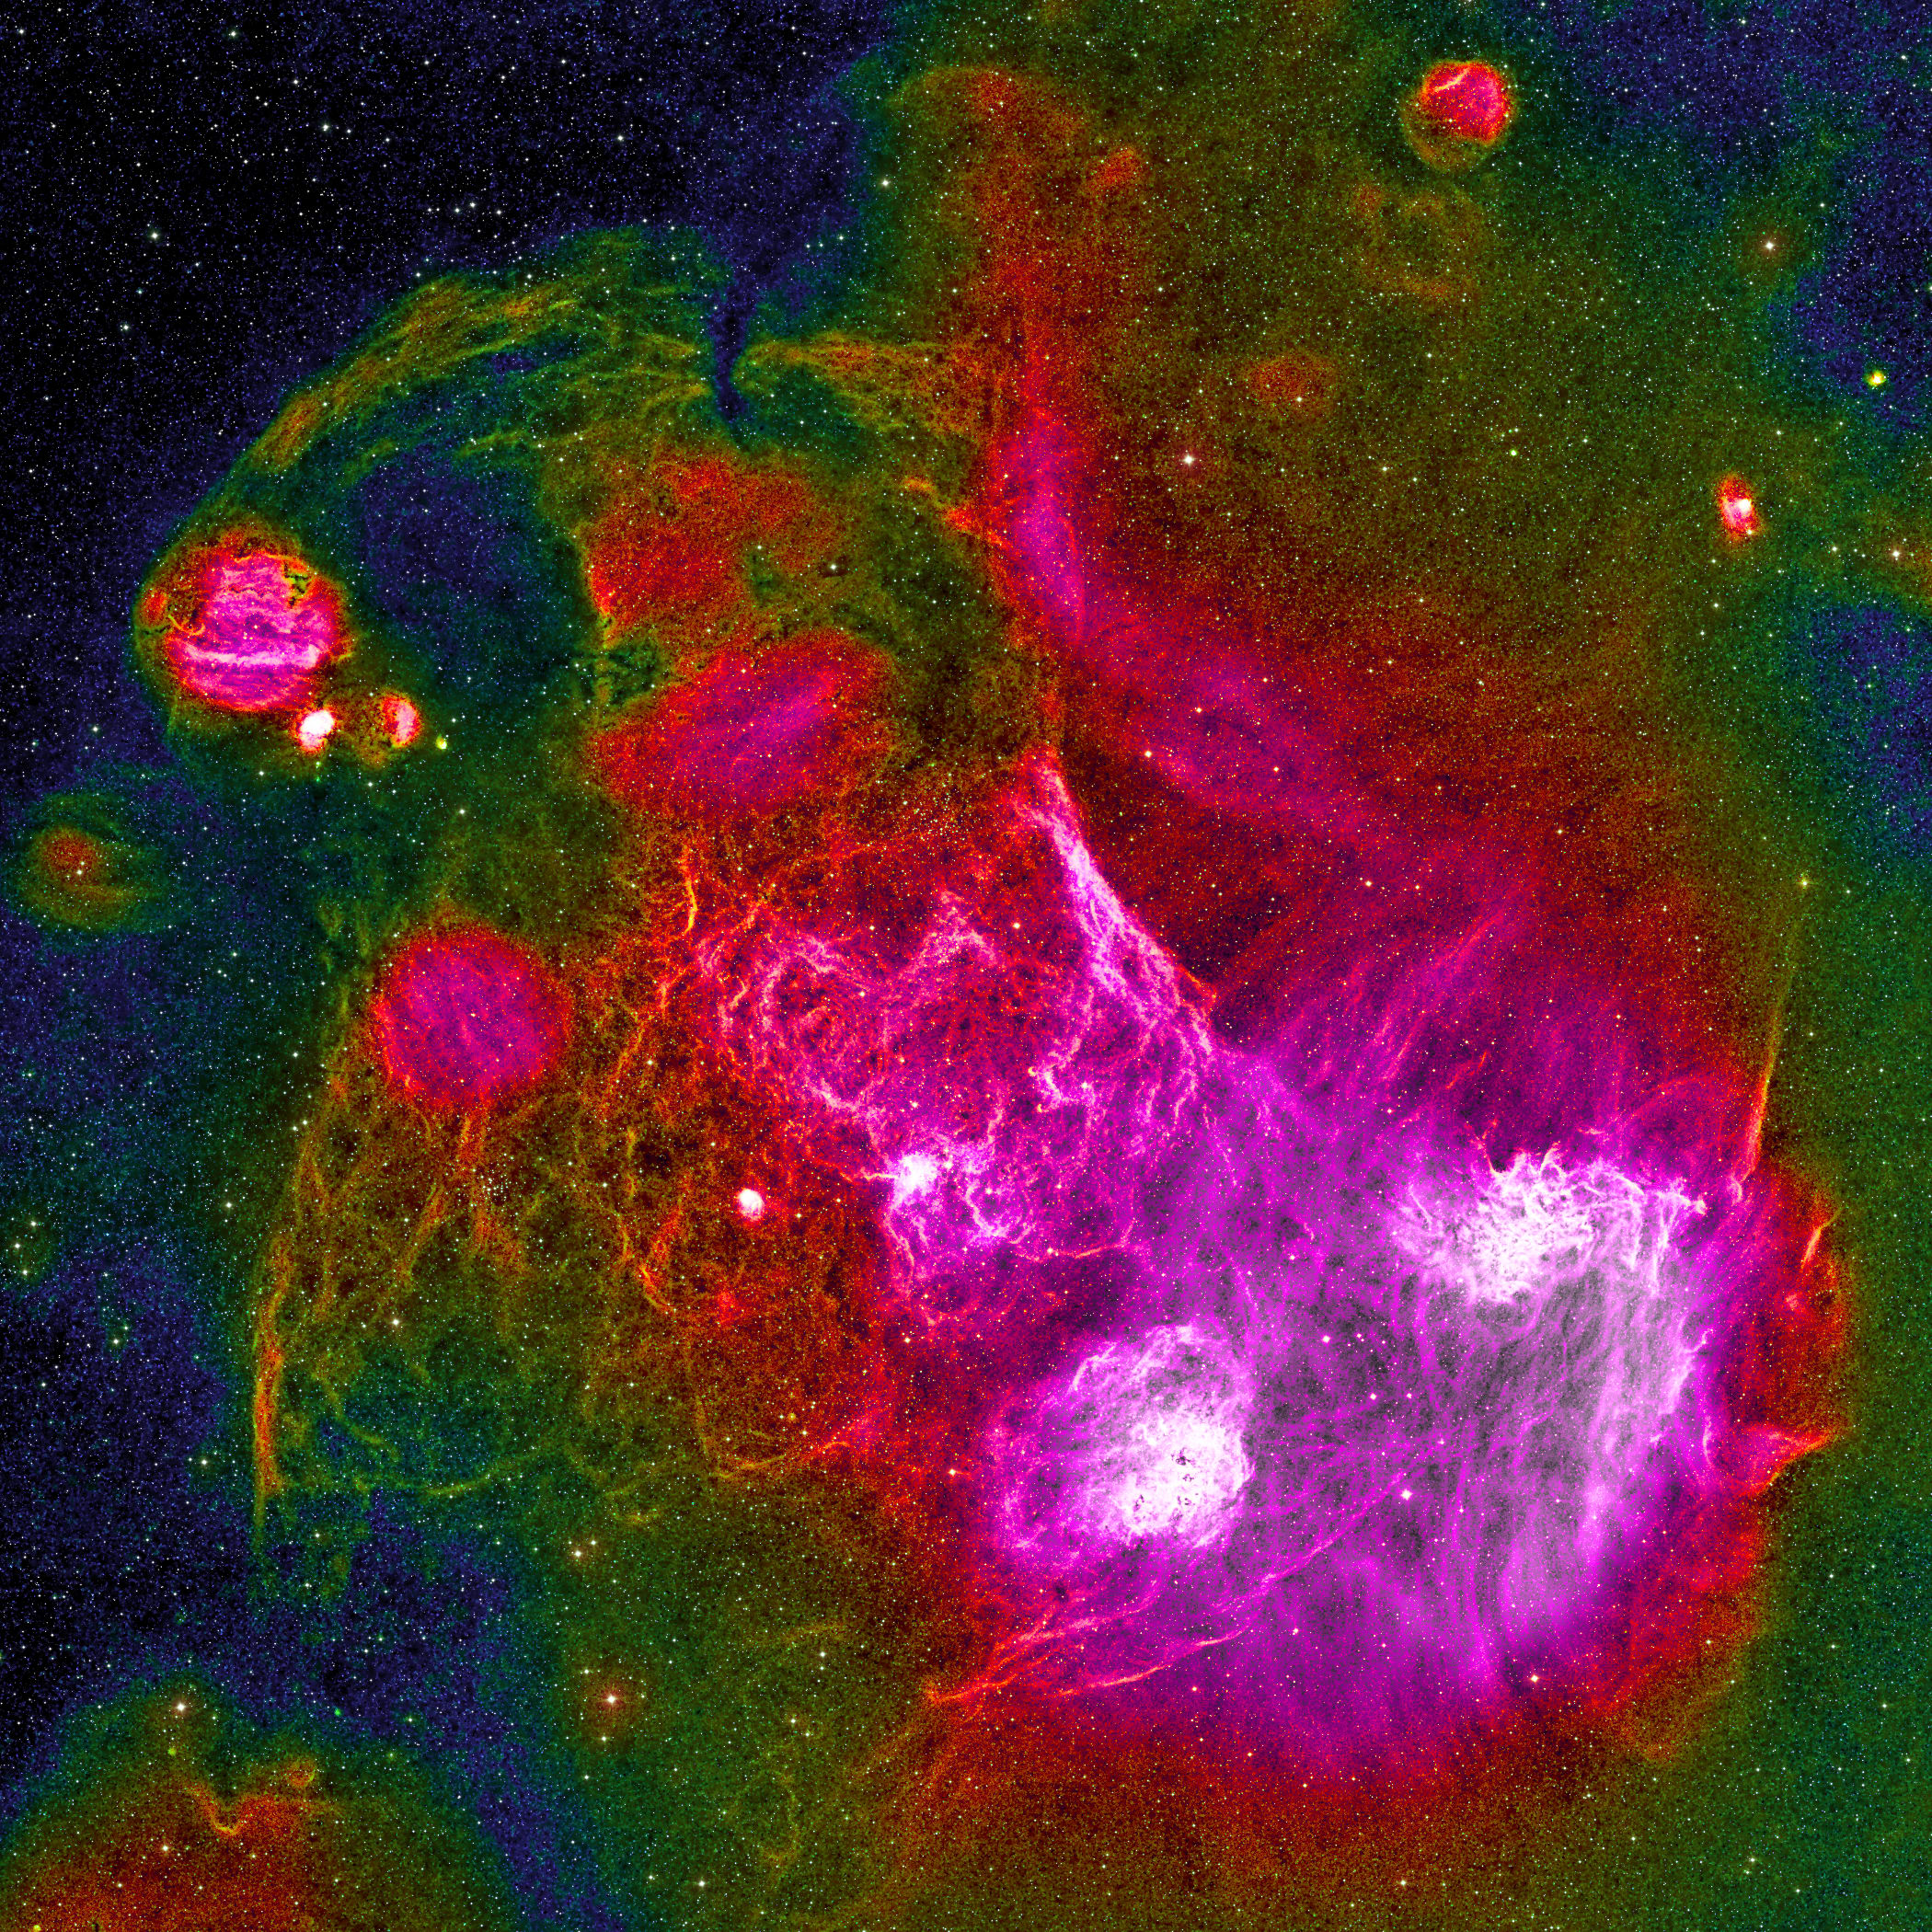
- False color images containing H-alpha and continuum:
- False color images containing H-alpha and continuum:
- H-alpha is mapped to red, blue continuum is mapped to green, and red continuum (without H-alpha) is mapped to blue.
- Color of molecular clouds and reflection nebulae in the false color image is something between green (bluish in reality) and blue (reddish in reality).
- HII regions (ionized hydrogen) appear red to orange, depending on the amount of OIII (doubly ionized oxygen) detected by the blue continuum filter.
- HII regions can be obscured (i.e. their radiation is scattered and/or absorbed) by molecular clouds that lie in front of them. However, emission nebulae do not obscure molecular clouds.
This means that a HII region lies farther away if it appears to be hidden by a visible molecular cloud or a dark nebula. If molecular clouds and HII regions look somehow mixed (pinky red), the HII region is either nearer, or the molecular cloud is very thin.
The latter aspect is the reason why it is difficult to determine whether an unobscured HII region lies in front of the molecular cloud.
An improved visualization of the correlation between HII regions and molecular clouds is planned as soon as better data are available, namely NIR data, which better indicate regions that are optically thick for H-alpha emission.
- SIMBAD queries for certain object types can be made easily in the JavaScript Viewer by drawing a circle and pressing a shortcut key or via the menu
- A repository with the discoveries can also be found on GitHub
Image data
Images where captured with a camera array which is described on the instruments page.Image data are:
| Projection type: | Stereographic | ||||
|---|---|---|---|---|---|
| Center position: | RA: 4h36', DEC: 32° | ||||
| Orientation: |
| ||||
| Scale: | 10 arcsec/pixel (in center at maximum resolution) | ||||
| FOV: | 35°×25° (RA×DEC, through center) | ||||
| Exposure times: |
Sum of exposure times of all frames used to calculate the image.
|
Image processing
All image processing steps are deterministic, i.e. there was no manual retouching or any other kind of non-reproducible adjustment. The software which was used can be downloaded here.Image processing steps where:
- Bias correction, dark current subtraction, flatfield correction
- Alignment and brightness calibration using stars from reference image
- Stacking with masking unlikely values and background correction
- Star subtraction
- Denoising and deconvolution both components (stars and residual)
- RGB-composition (same factor for stars and residual for the true color composite)
- Dynamic range compression using non-linear high-pass filter
- Tonal curve correction
References
- Gibson, S.J.; Nordsieck, K.H. (2003). "The Pleiades Reflection Nebula. II. Simple Model Constraints on Dust Properties and Scattering Geometry". The Astrophysical Journal. 589 (1): 362–377.
- P. A. B. Galli 1, L. Loinard 2,3 H. Bouy 1, L. M. Sarro 4, G. N. Ortiz-León 5, S. A. Dzib 5, J. Olivares 1, M. Heyer 6, J. Hernandez 7, C. Román-Zúñiga 7, M. Kounkel 8, and K. Covey, (2019). "Structure and kinematics of the Taurus star-forming region from Gaia-DR2 and VLBI astrometry". Astronomy & Astrophysics 630: A137.
- Gisela N. Ortiz-León et al. (2018.) "The Gould's Belt Distances Survey (GOBELINS). V. Distances and Kinematics of the Perseus Molecular Cloud." The Astrophysical Journal, 865 (1): 73
- Ungerechts, H. & Thaddeus, P. (1987). "A CO survey of the dark nebulae in Perseus, Taurus, and Auriga". Astrophysical Journal Supplement Series, 63: 645-660.
